Even A Bad Test Can Help Guide the Decision to Isolate: Covid Simulations Part 3
How much difference does it make if the test used to send people into quarantine is bad? Not as much as you might think.
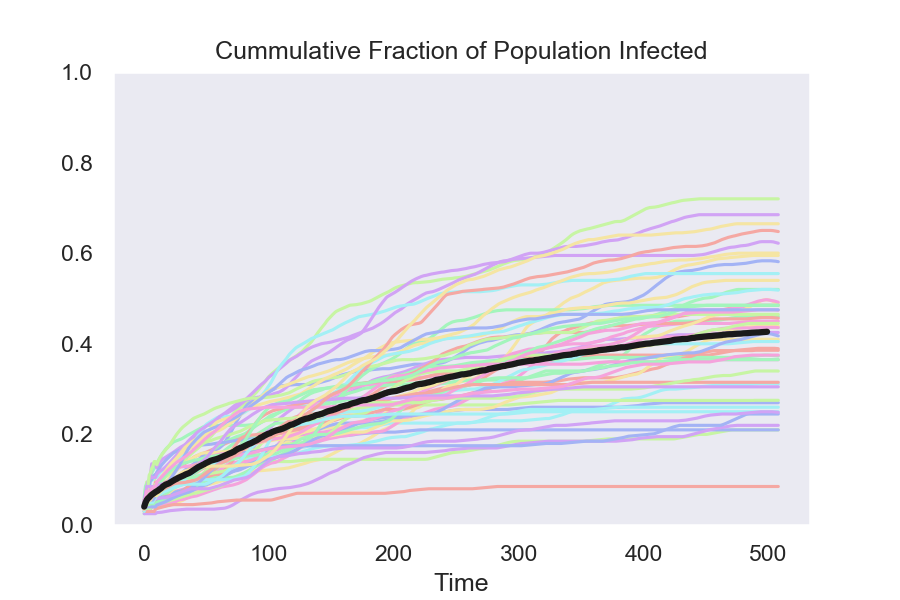
The simulated data here contrast policies that isolate people who test positive using four different assumptions about the quality of the test. Even a very bad test cuts the fraction of the population who are ultimately infected almost in half. And when I say bad, I mean bad – an 80% false negative rate, which means that 4 out of 5 of people who are truly infectious will get a negative test result – i.e. a result saying that they are not infectious.
From bad to better, results show:
- The baseline with no testing, no isolation
- A test with an 80% false negative rate
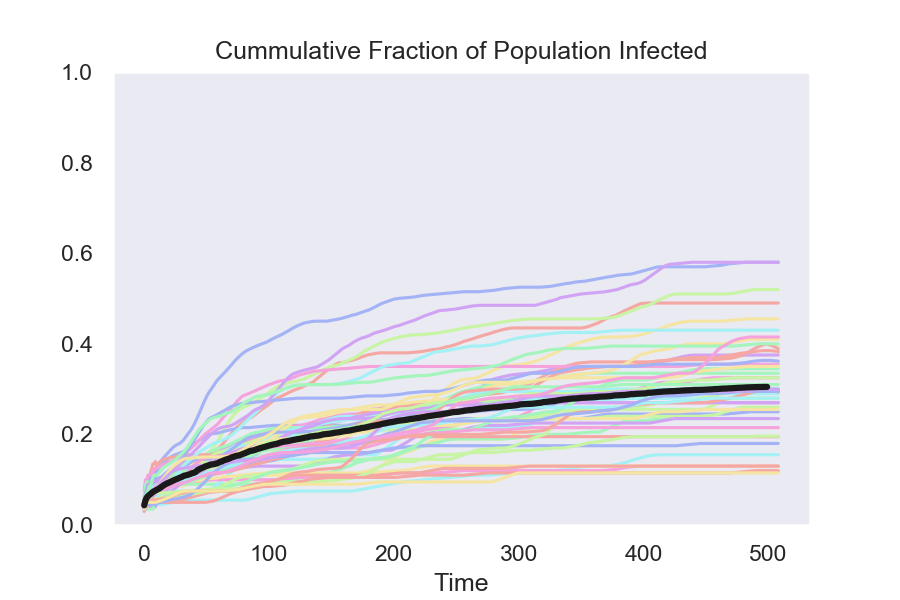
- A test with a 60% false negative rate
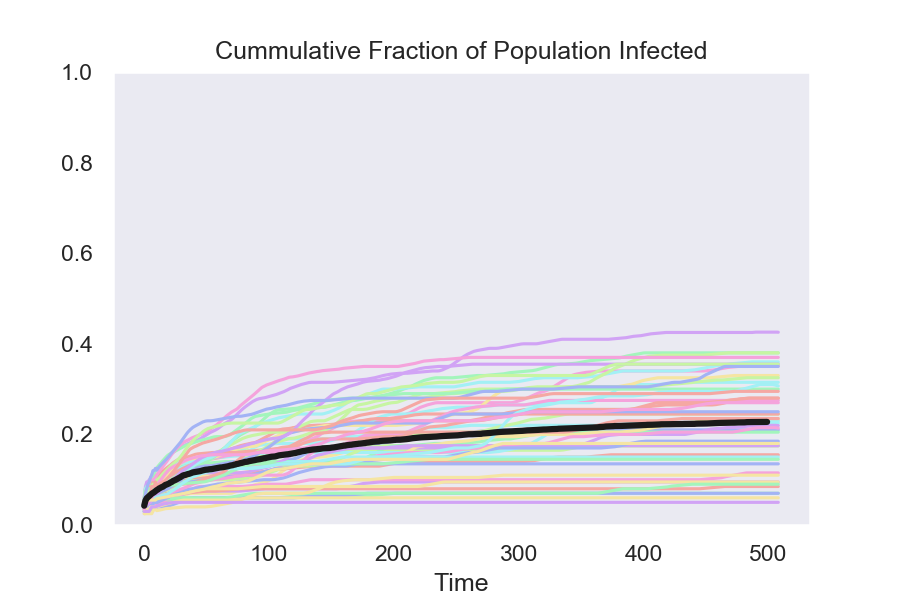
- A test with a 40% false negative rate
- A test with a 20% false negative rate
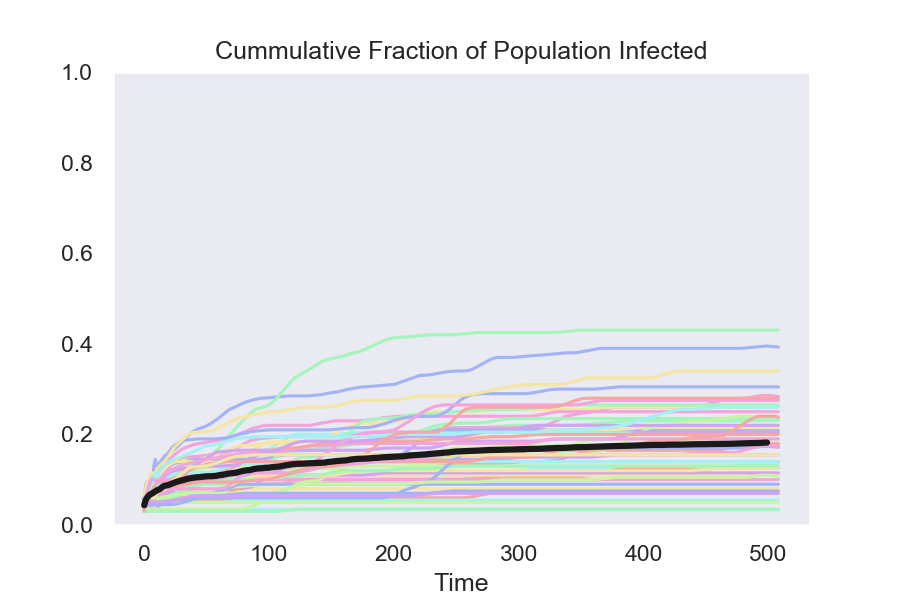
Baseline - no isolation
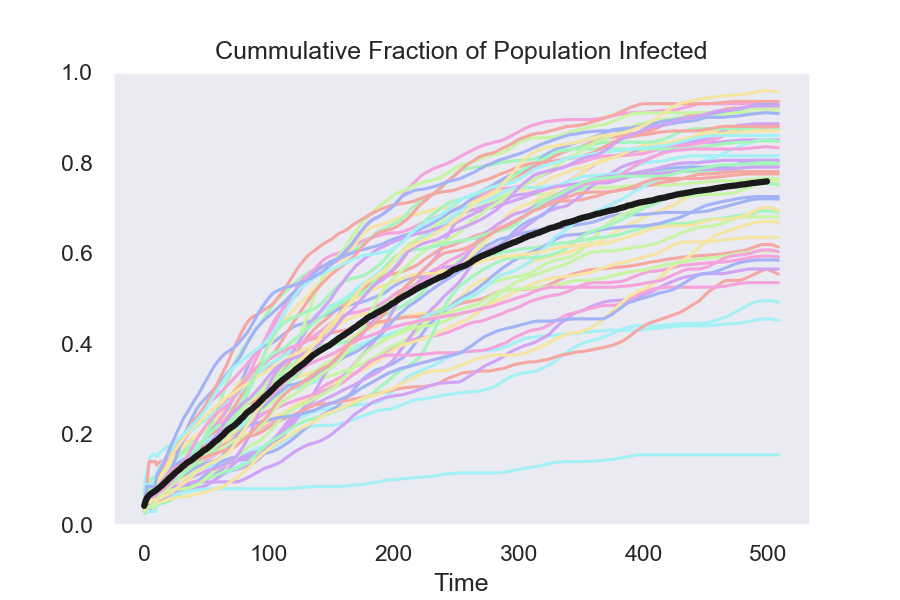
Isolate using test with 80% false negatives
Isolate using test with 60% false negatives
Isolate using test with 40% false negatives
Isolate using test with 20% false negatives
Details:
The colored lines in the graphs show the results from 50 runs of the model. The black line is the average at each date of these 50 runs.
The final result, with a 20% false negative rate, is the one that I used in my previous post.
In the four cases with testing, I hold constant the fraction of the population that gets tested each day. (Increasing this fraction would be one way to compensate for a bad test.)
As a result, simulations with a higher false negative rate will put fewer people who are infectious into quarantine.
It shouldn’t really come as a surprise, but any policy that puts people who are infectious into quarantine will slow the spread of the disease.