It Would be Crazy to Raise Rates
In my interview on Bloomberg (also picked up here) I responded to a question about what the Fed should do by saying
“It would be crazy to raise rates.”
I meant that literally.
A Fact Beats a Theory Every Time
I prefaced my remarks by saying that no one expected what has happened–inflation has declined dramatically without any perceptible reduction in employment or any slow down in the GDP growth. The best we can do now is feel our way along in the dark, paying extra attention to the facts. The worst response would be to fall back on a textbook analysis that fails to fit the facts.
What Do the Facts Show?
The facts about both how far inflation has fallen and how fast it is falling imply that the inflation rate could reach the target level of about ||2\%|| within three or four months.
If the Fed is serious about leveling off at that target level, it needs to start slowing the pace of decline in inflation now.
What About Uncertainty?
Yes, this is a time of unusual uncertainty. Yes, something unexpected could happen. Yes, inflation could go back up.
If it does, keep following the facts. Raise rates then when the facts say that you should.
But if the Fed wants to show us that it is serious about following the facts, it has to respond to the facts that confront us, not to possibilities that it can imagine.
Background On the Inflation Rate
In what follows I rely on the raw (that is, not seasonally adjusted) CPI-U Less Food and Energy. See my previous post for the logic behind these choices. Note in particular the problems demonstrated there with the seasonally adjusted versions of the CPI constructed by the Bureau of Labor Statistics.
Price Changes over 12-Month Intervals
Consider first the percentage change in the CPI index over the most recent 12-month interval and the three 12-month intervals that came before:
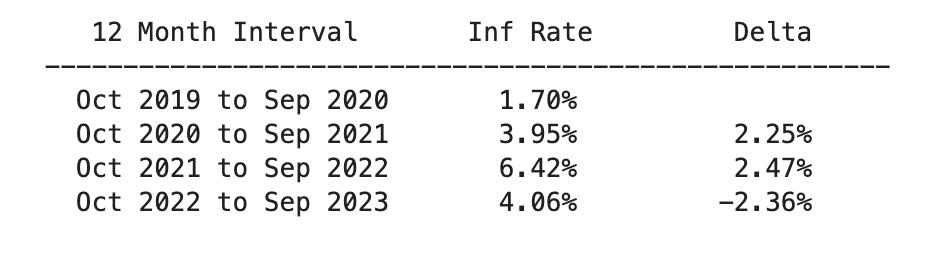
The table shows that the inflation rate increased from the first interval to the second, and from the second to the third, then decreased from the third to the most recent 12-month interval.
The advantage of a measure that spans 12 months is that it will not be affected by seasonal fluctuations or seasonal adjustments. The comparable table produced using the seasonally adjusted series from the BLS yields almost exactly the same results.
Six-Month Windows
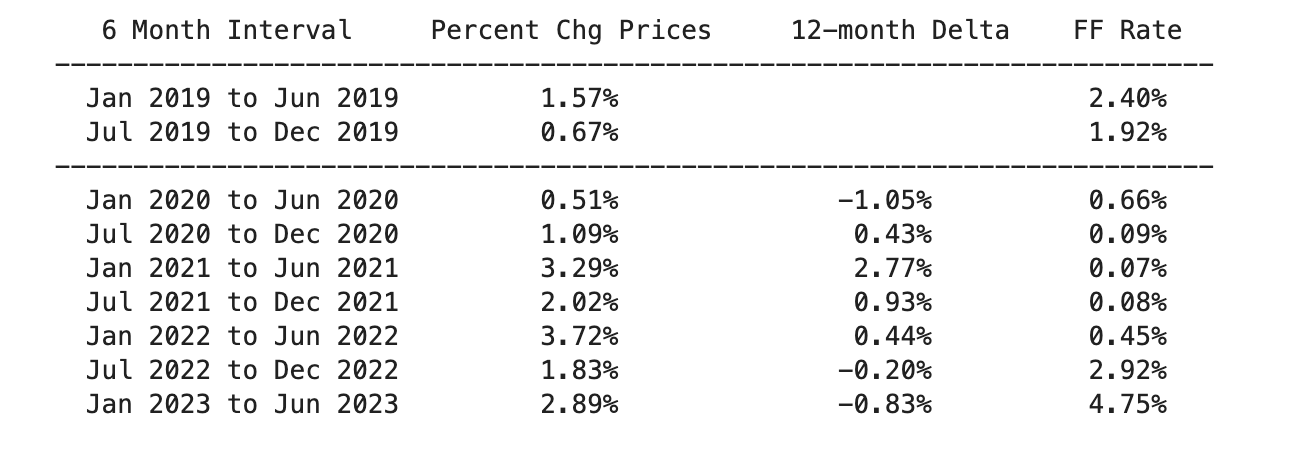
The problem with a twelve-month window is that it obscures changes that have taken place within those twelve months. So consider next a series of six-month intervals that reveal more about recent behavior:
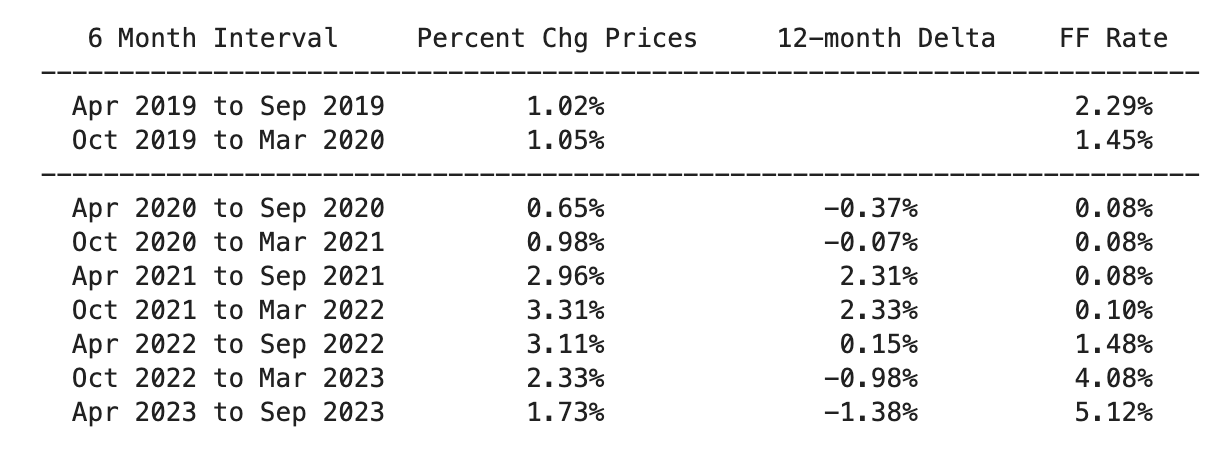
To make sense of this table, start with the bottom row. The first two columns show that in the last six months, the total percentage increase in the CPI index was ||1.73\%.|| Moving up one row, the same two columns show that in the six months that came before, the price index increased by ||2.33\%.||
If we add these two together, we get back the percentage increase in the CPI over the last twelve months, the value presented in last row of the table with 12-month intervals:
$$ 2.33\% + 1.73\% = 4.06\%$$
The third column looks at percentage increases during the same calendar months, for the most recent months and the same months one year earlier. The difference between these two percentage changes removes any seasonal effect that is specific to those months. For example, the last entry in the third column shows that the rate of increase in prices during the months April-September 2023 was ||1.38\%|| percentage points lower than the rate of increase during the same months, April-September, of the previous year, 2022.
Now compare this reduction with the one that is just above it in column three. The reduction in the rate of increase of prices during October 2022–March 2023 relative to October 2021–March 2022 was ||0.98\%.||
Note that these two numbers, which measure changes in the rate of increase of prices in two six month intervals add up to the change in the rate of increase of prices over the entire 12-month interval:
$$ 0.98\% + 1.38\% = 2.36\%$$
This means that the way to decompose the change in the rate of price increases over the entire 12-month interval is use the two “12-month deltas” reported in column 3.
These values show not just that the rate of inflation is falling, but also that the pace of the decline is getting bigger.
-
Most recent 6-months: Price change is ||1.38|| percentage points smaller than in same months one year ago
-
Previous 6-months: Price change is ||0.98|| percentage points smaller than in the same months one year ago
To use an analogy from aviation in which inflation is altitude, the plane is descending, and the dive is getting steeper. The plane needs to level off very soon, so it would be crazy to try to make the dive even steeper by raising rates again.
The Fed Funds Rate
For reference, the final column presents the average Fed Funds Rate for the six-month interval specified on each row.
Could The Most Recent Results be a Fluke?
It is reasonable to ask if these conclusions are a fluke caused by some strange result that only shows up in the most recent observations.
I’ve been doing this analysis for months (and reporting on my blog.) The results have been remarkably consistent.
One way to simulate this is to work backwards. Step back one month at a time and redo the analysis that would have been possible with only the data that had been available in the past.
One Month Ago
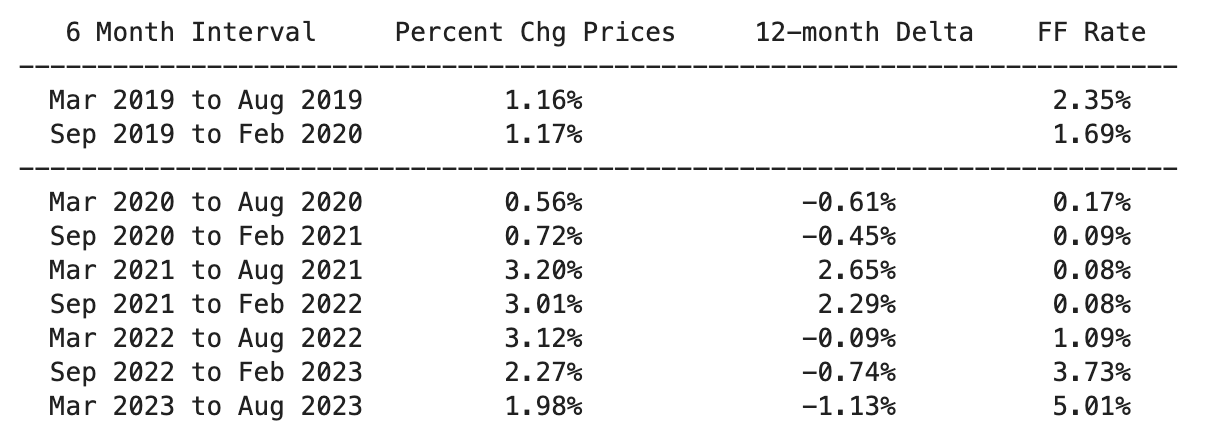
Using data up through and including August 2023, the comparison of the most recent six-month intervals shows once again that the most recent interval has the faster declines:
-
Most recent 6-months: Price change is ||1.13|| percentage points smaller than in the same months one year ago
-
Previous 6-months: Price change is ||0.74|| percentage points smaller than in the same months one year ago
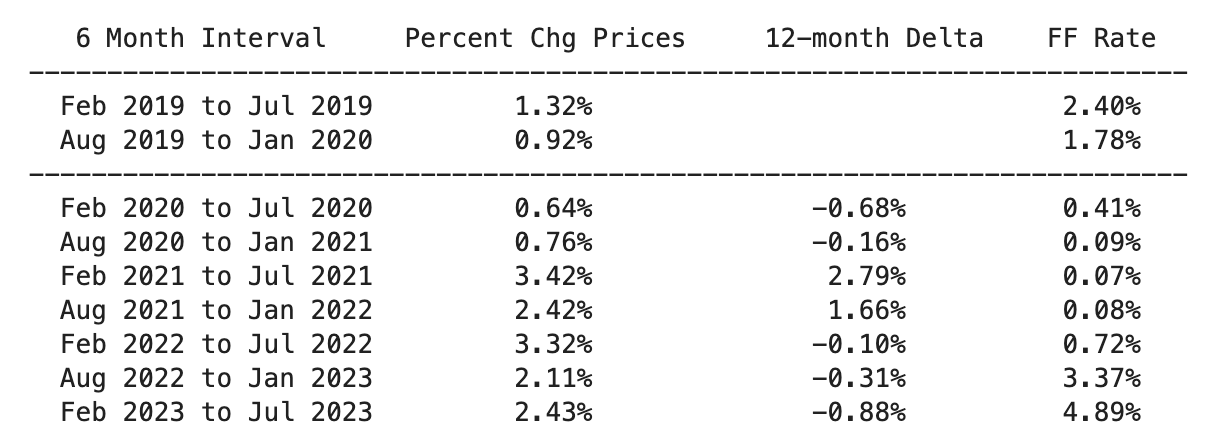
Two Months Ago
-
Most recent 6-months: Price change is ||0.88|| percentage points smaller than in the same months one year ago
-
Previous 6-months: Price change is ||0.31|| percentage points smaller than in the same months one year ago
Three Months Ago
-
Most recent 6-months: Price change is ||0.83|| percentage points smaller than in the same months one year ago
-
Previous 6-months: Price change is ||0.20|| percentage points smaller than in the same months one year ago
Conclusion
The data show unambiguously that inflation initiated a descent back in the fall of 2022 that has consistently gotten steeper.
So how soon will we hit the target?
The number that people tend to quote for the current inflation rate is the most recent 12-month average. The first table shows that for the interval ending in September 2023, this was ||4.06\%.|| But of course, if the inflation rate was decreasing over those twelve months, the value now will be lower than the average over all twelve months.
In my previous post, I narrowed the focus to single months and showed that the implied estimate for the current inflation rate during September 2023, was ||2.76\%.||
If you scroll back up to the table with the most recent data on the six-month intervals, you’ll see that the most recent decline in inflation was ||1.38|| percentage in just six months, or a decrease of ||23|| basis points per month. At this rate, inflation will arrive at the target level in 3 months.
So it would literally be crazy to try to put the economy into an even steeper dive by raising interest rates now.
The facts show that it is time to start leveling off.