Even More Good News about Inflation
Here’s the latest update in a series of posts about seasonal adjustment and progress toward lower inflation. The CPI data released today suggest that we are, indeed, making substantial progress toward a lower inflation rate. The worrisome indications from February and March may simply have been caused by noise.
Seasonal Effects
If you’ve been following along, you’ll recall that the changes that the BLS made to the seasonal adjustment factors that is applies to the CPI demonstrated how important seasonal factors might be and suggested that in this new post-covid era, there is a lot of uncertainty about the true seasonal factors. From this, I concluded that it is important to take a look at the raw month-to-month inflation numbers and use them to compare inflation in a recent month with inflation in the same month one year ago.
This graph updates the graphs that I’ve posted before with data for May. For consistency, in each post I examine only CPI-U less food and energy.
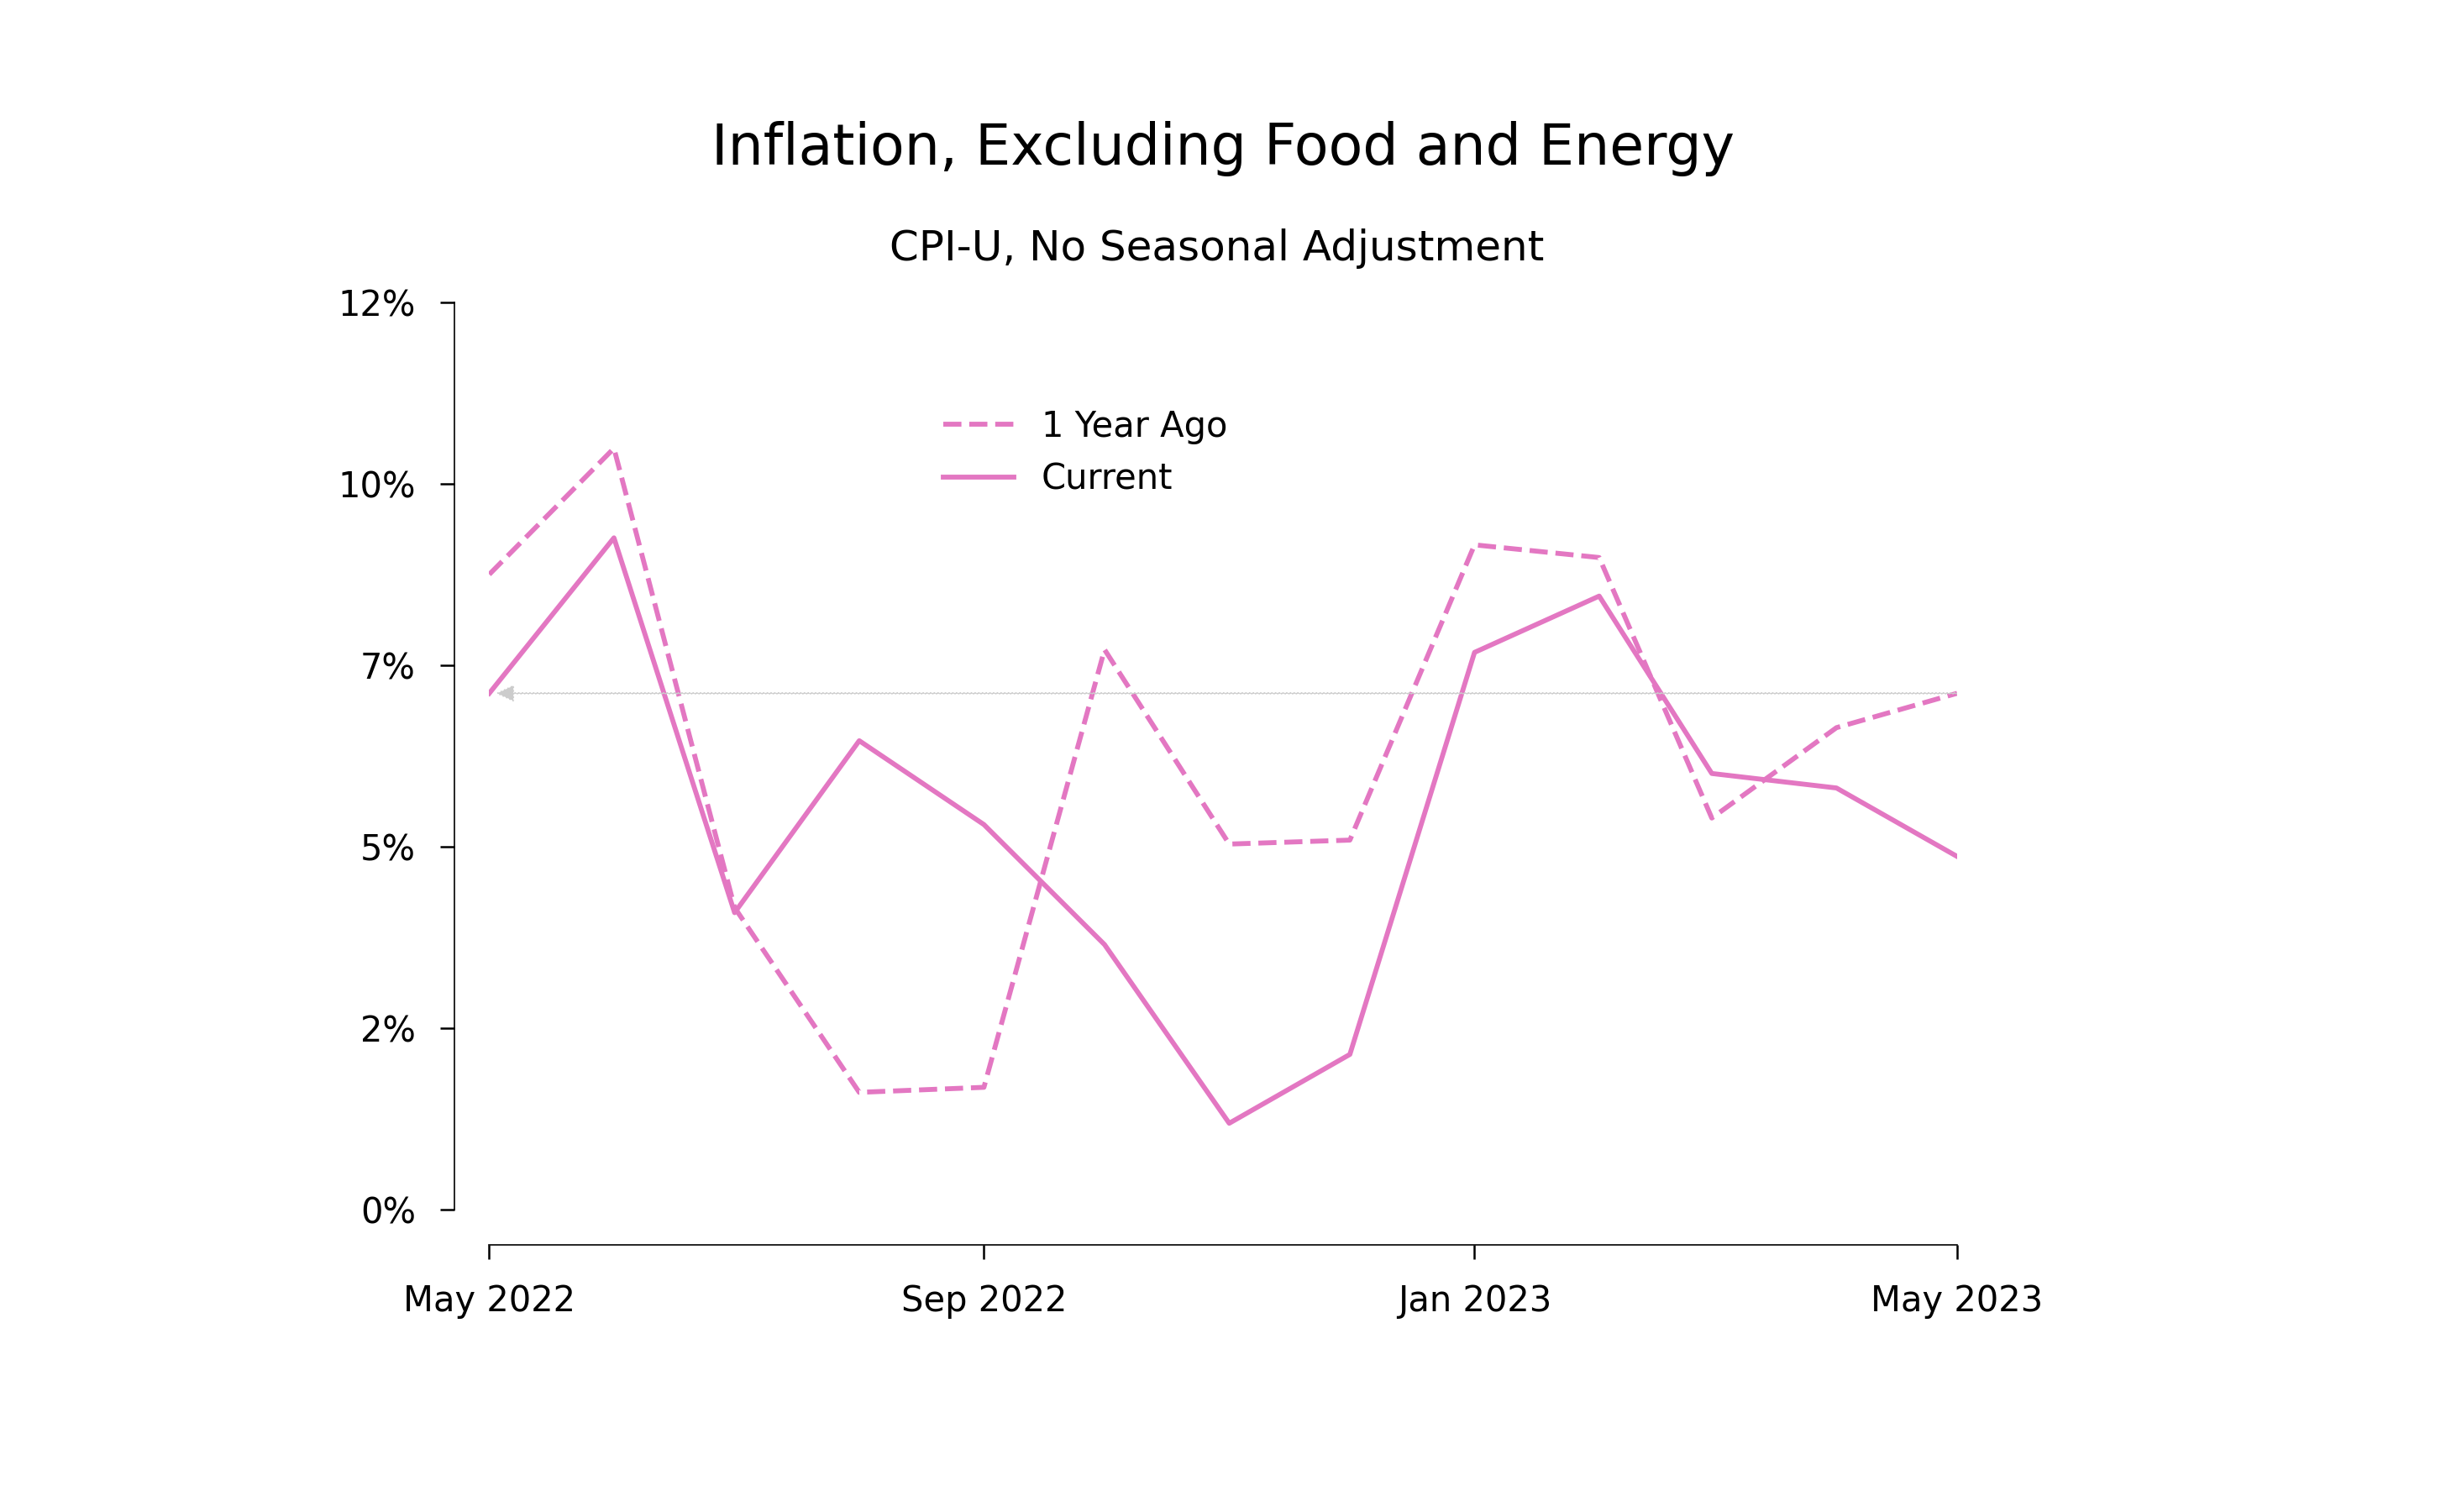
Here are the possibilities suggested by this graph:
-
In both the last 12 months and the previous 12 months, there is a general tendency for the monthly inflation rate to increase in Q4 and Q1.
-
During Q4 of 2022, the inflation rate seemed to be substantially lower than it had been during Q4 of 2021.
-
During February and March, it seemed as though that year-to-year hint of progress disappeared. In 2023, inflation in those months was about the same as inflation in 2022.
-
During April and May, the indication of year-to-year progress has returned. Inflation in May 2023 is about 200 basis points lower than inflation in May 2022. The impression from February and March that there has been no year-to-year progress may have been the result of noise in the monthly inflation rates.
One cannot repeat often enough that there is substantial uncertainty about what is happening with the inflation rate. This means that it is important to look at the small amount of evidence we have from several perspectives. The perspective based on year-to-year changes suggests that what the data show is a combination of a year-to-year reduction in the inflation rate, plus a seasonal pattern of higher inflation in Q4 and Q1, plus noise.
The Problem with Seasonally Adjusted Data
The crucial point is that as the next graph shows, this possibility of real progress is not evident in the recent seasonally adjusted data:
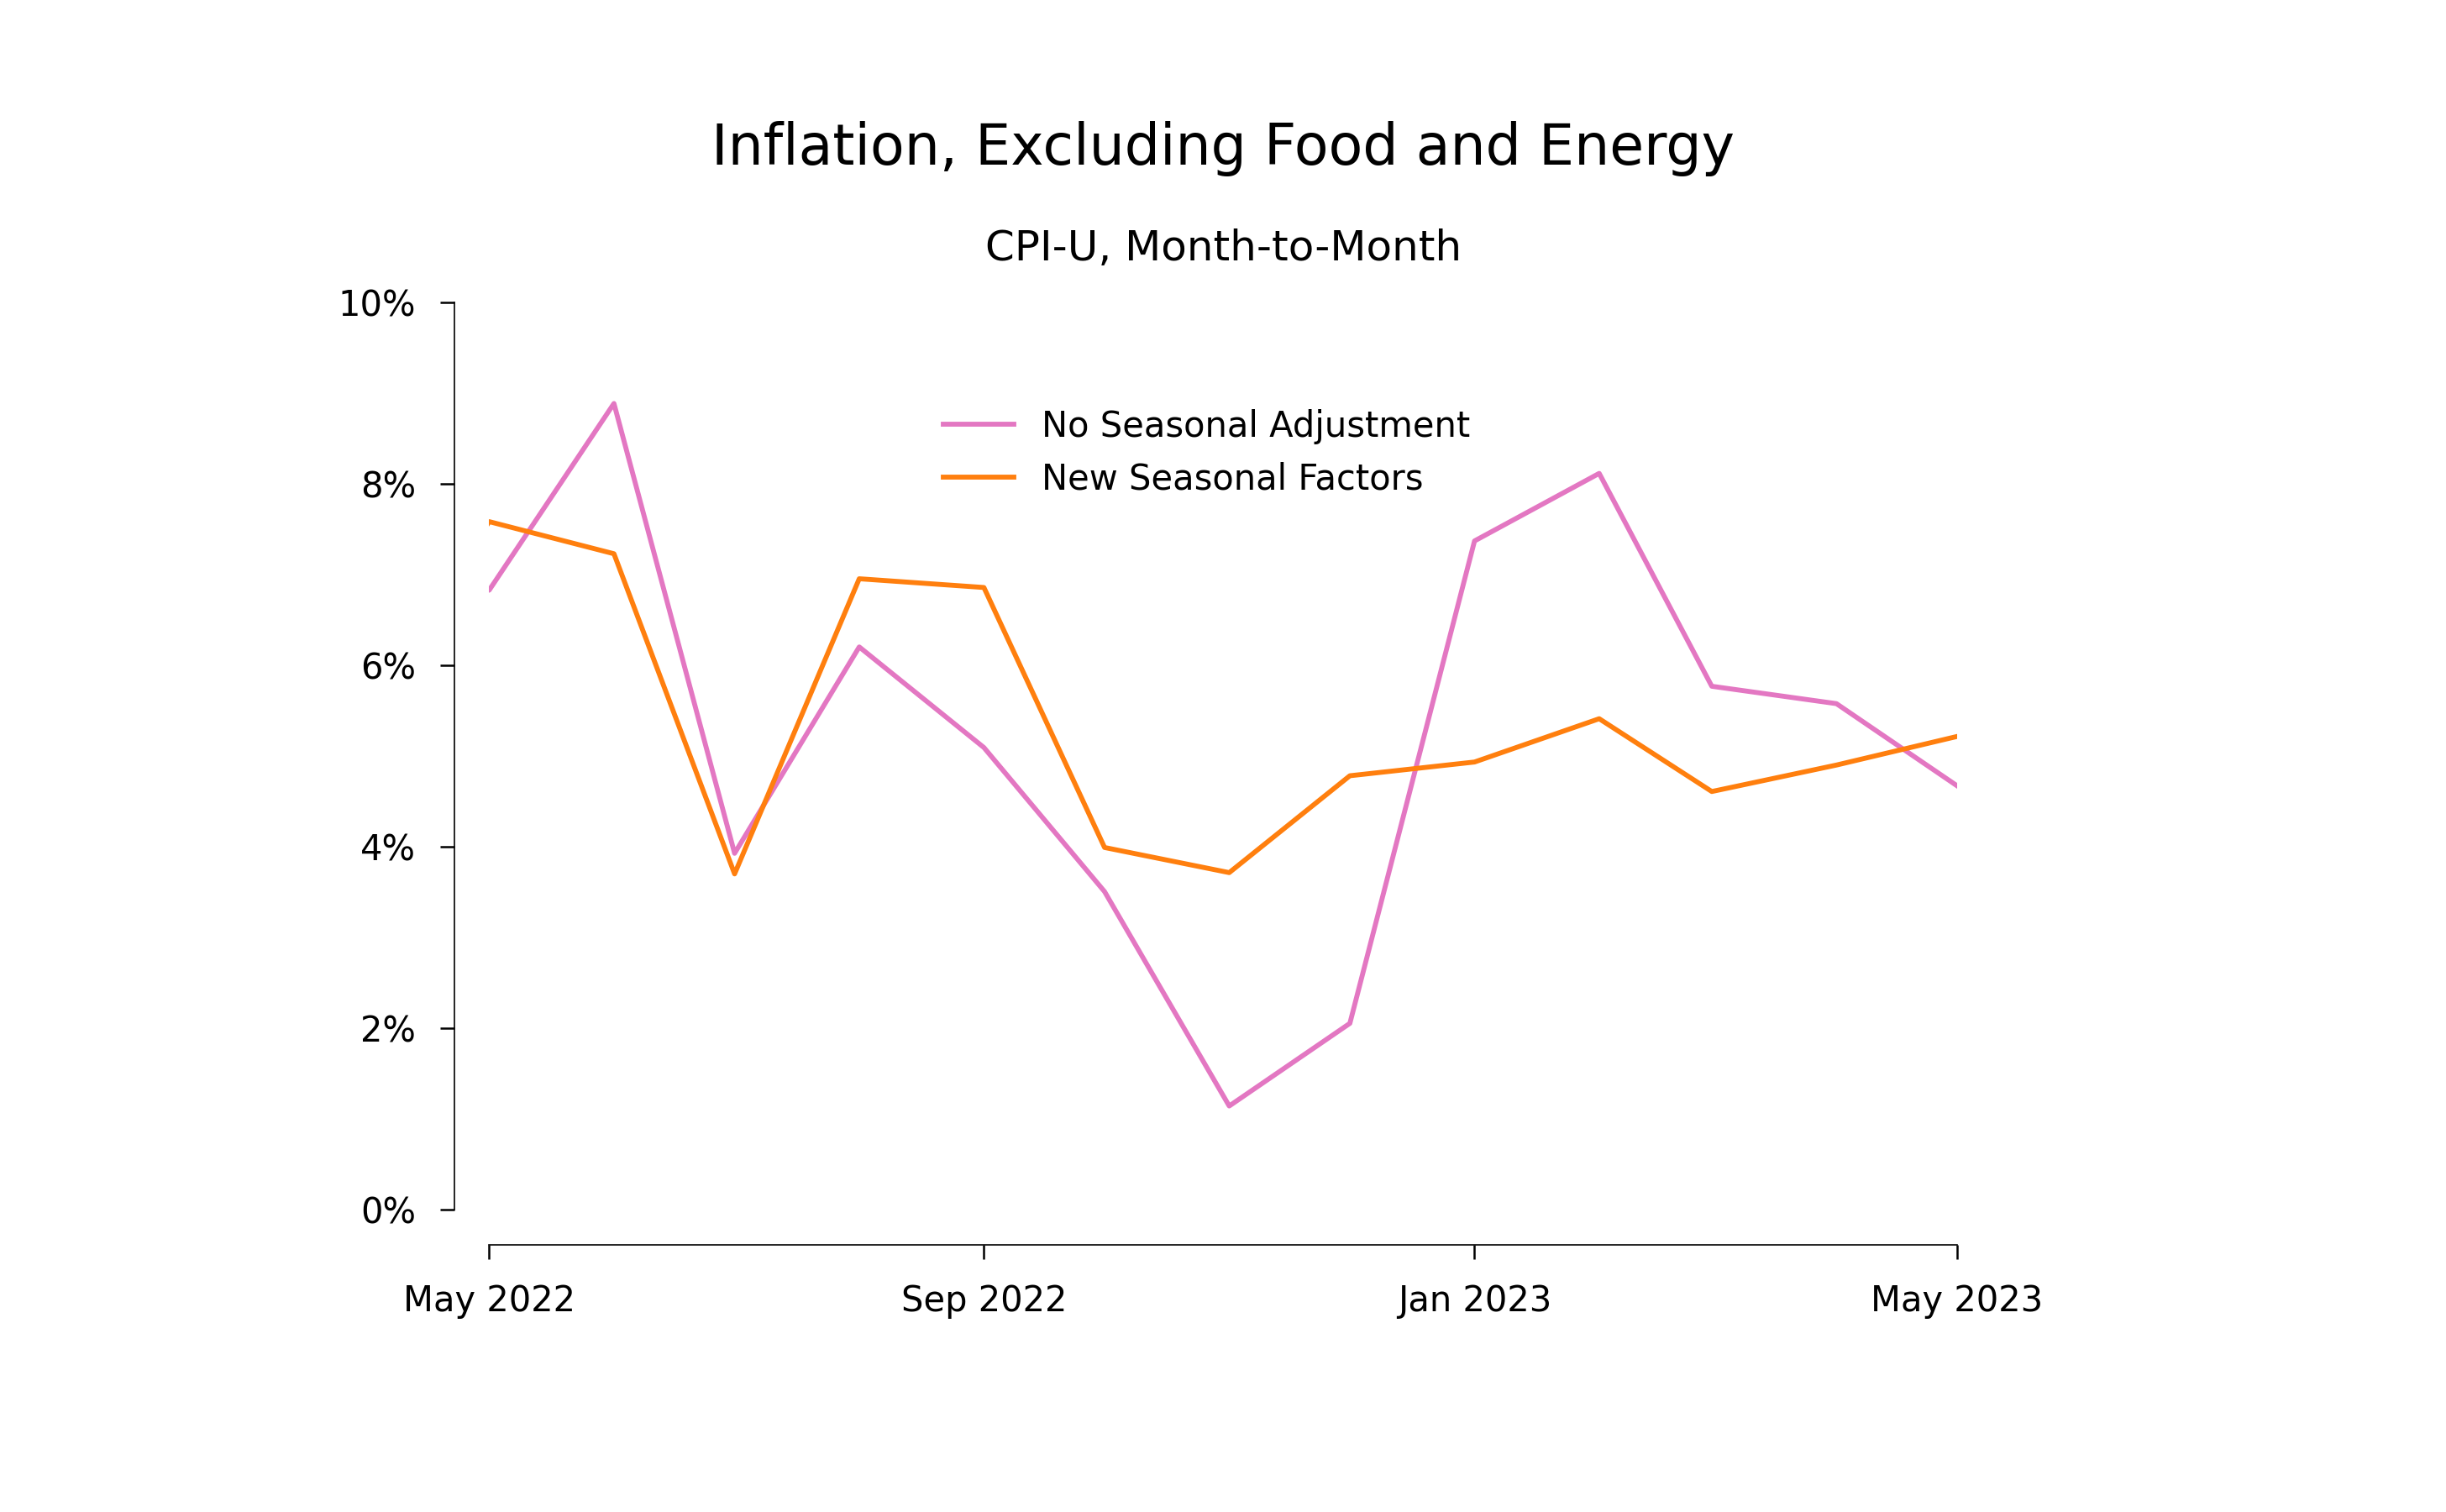
These data suggest that the trend the April and May is a continuation of the trend that has been evident since October–a trend increase in the inflation rate. This inference is correct only if we assume that the seasonal adjustment factors that the BLS is using are perfect. But we should have no confidence that we can estimate the correct seasonal adjustment factors on the basis of the limited data available to us in the post-covid era. So it is entirely possible that the suggestion of an upward trend is a sign that the new seasonal adjustment factors do not fully capture the true seasonal pattern of higher monthly inflation rates during Q4 and Q1.
Progress Toward Lower Inflation
The reduction in the inflation rate has persisted long enough to show up in comparisons of 12 month inflation rates. From May 2021 to May 2022 the inflation rate for CPI-U less food and energy was 5.8%. In the last 12 months, from May 2022 to May 2023, the inflation rate was 5.2%. So 12-month averages, which should be free of any seasonal effects, suggest that inflation is down by 60 basis points.
Moreover, the progress toward lower inflation may have started in the second half of the last 12 months. If we measure the annualized inflation rate over the last 6 months and compare it with the rate for the same months one year before, the inflation rate fell from 6.8% to 5.6%, or by 120 basis points. (Remember that the levels for these two rates will be higher than the 12-month rates if there is a seasonal pattern of faster increases during Q4 and Q1.)
A reduction in the inflation rate by 120 basis points is not as large as the reduction seemed to be on the basis of a couple of good months back in Q4 of 2022. But it is still substantial. To be sure, the most recent 12-month rate of inflation of 5.2% remains high. Nevertheless, the data may be telling us that starting in the last six months, the underlying inflation rate in the US has been decreasing.
The actions already taken by the Fed may be having the desired effect. It may be time for patience.