Still Looks Like Inflation Decreased
TL;DR
Using the not seasonally adjusted CPI-U less food and energy, the average rate of increase for the months of October, November, December and January, was 6.5% in 2021–2. In 2022–3, the average for the same four months was 3.5%—down by 300 basis points.
What’s Going on with Seasonal Adjustment of the CPI?
This week, I discovered that I could no longer reproduce the graphs I posted last month about inflation. My stomach tightened as I contemplated the correction I was apparently going to have to publish. Where had I gone wrong?
It turns out that I wasn’t the problem. The graphs changed because the data changed. In February, the Bureau of Labor statistics changed the seasonal adjustment factors that it applies to the CPI and used these new factors to modify the data I display for 2022.
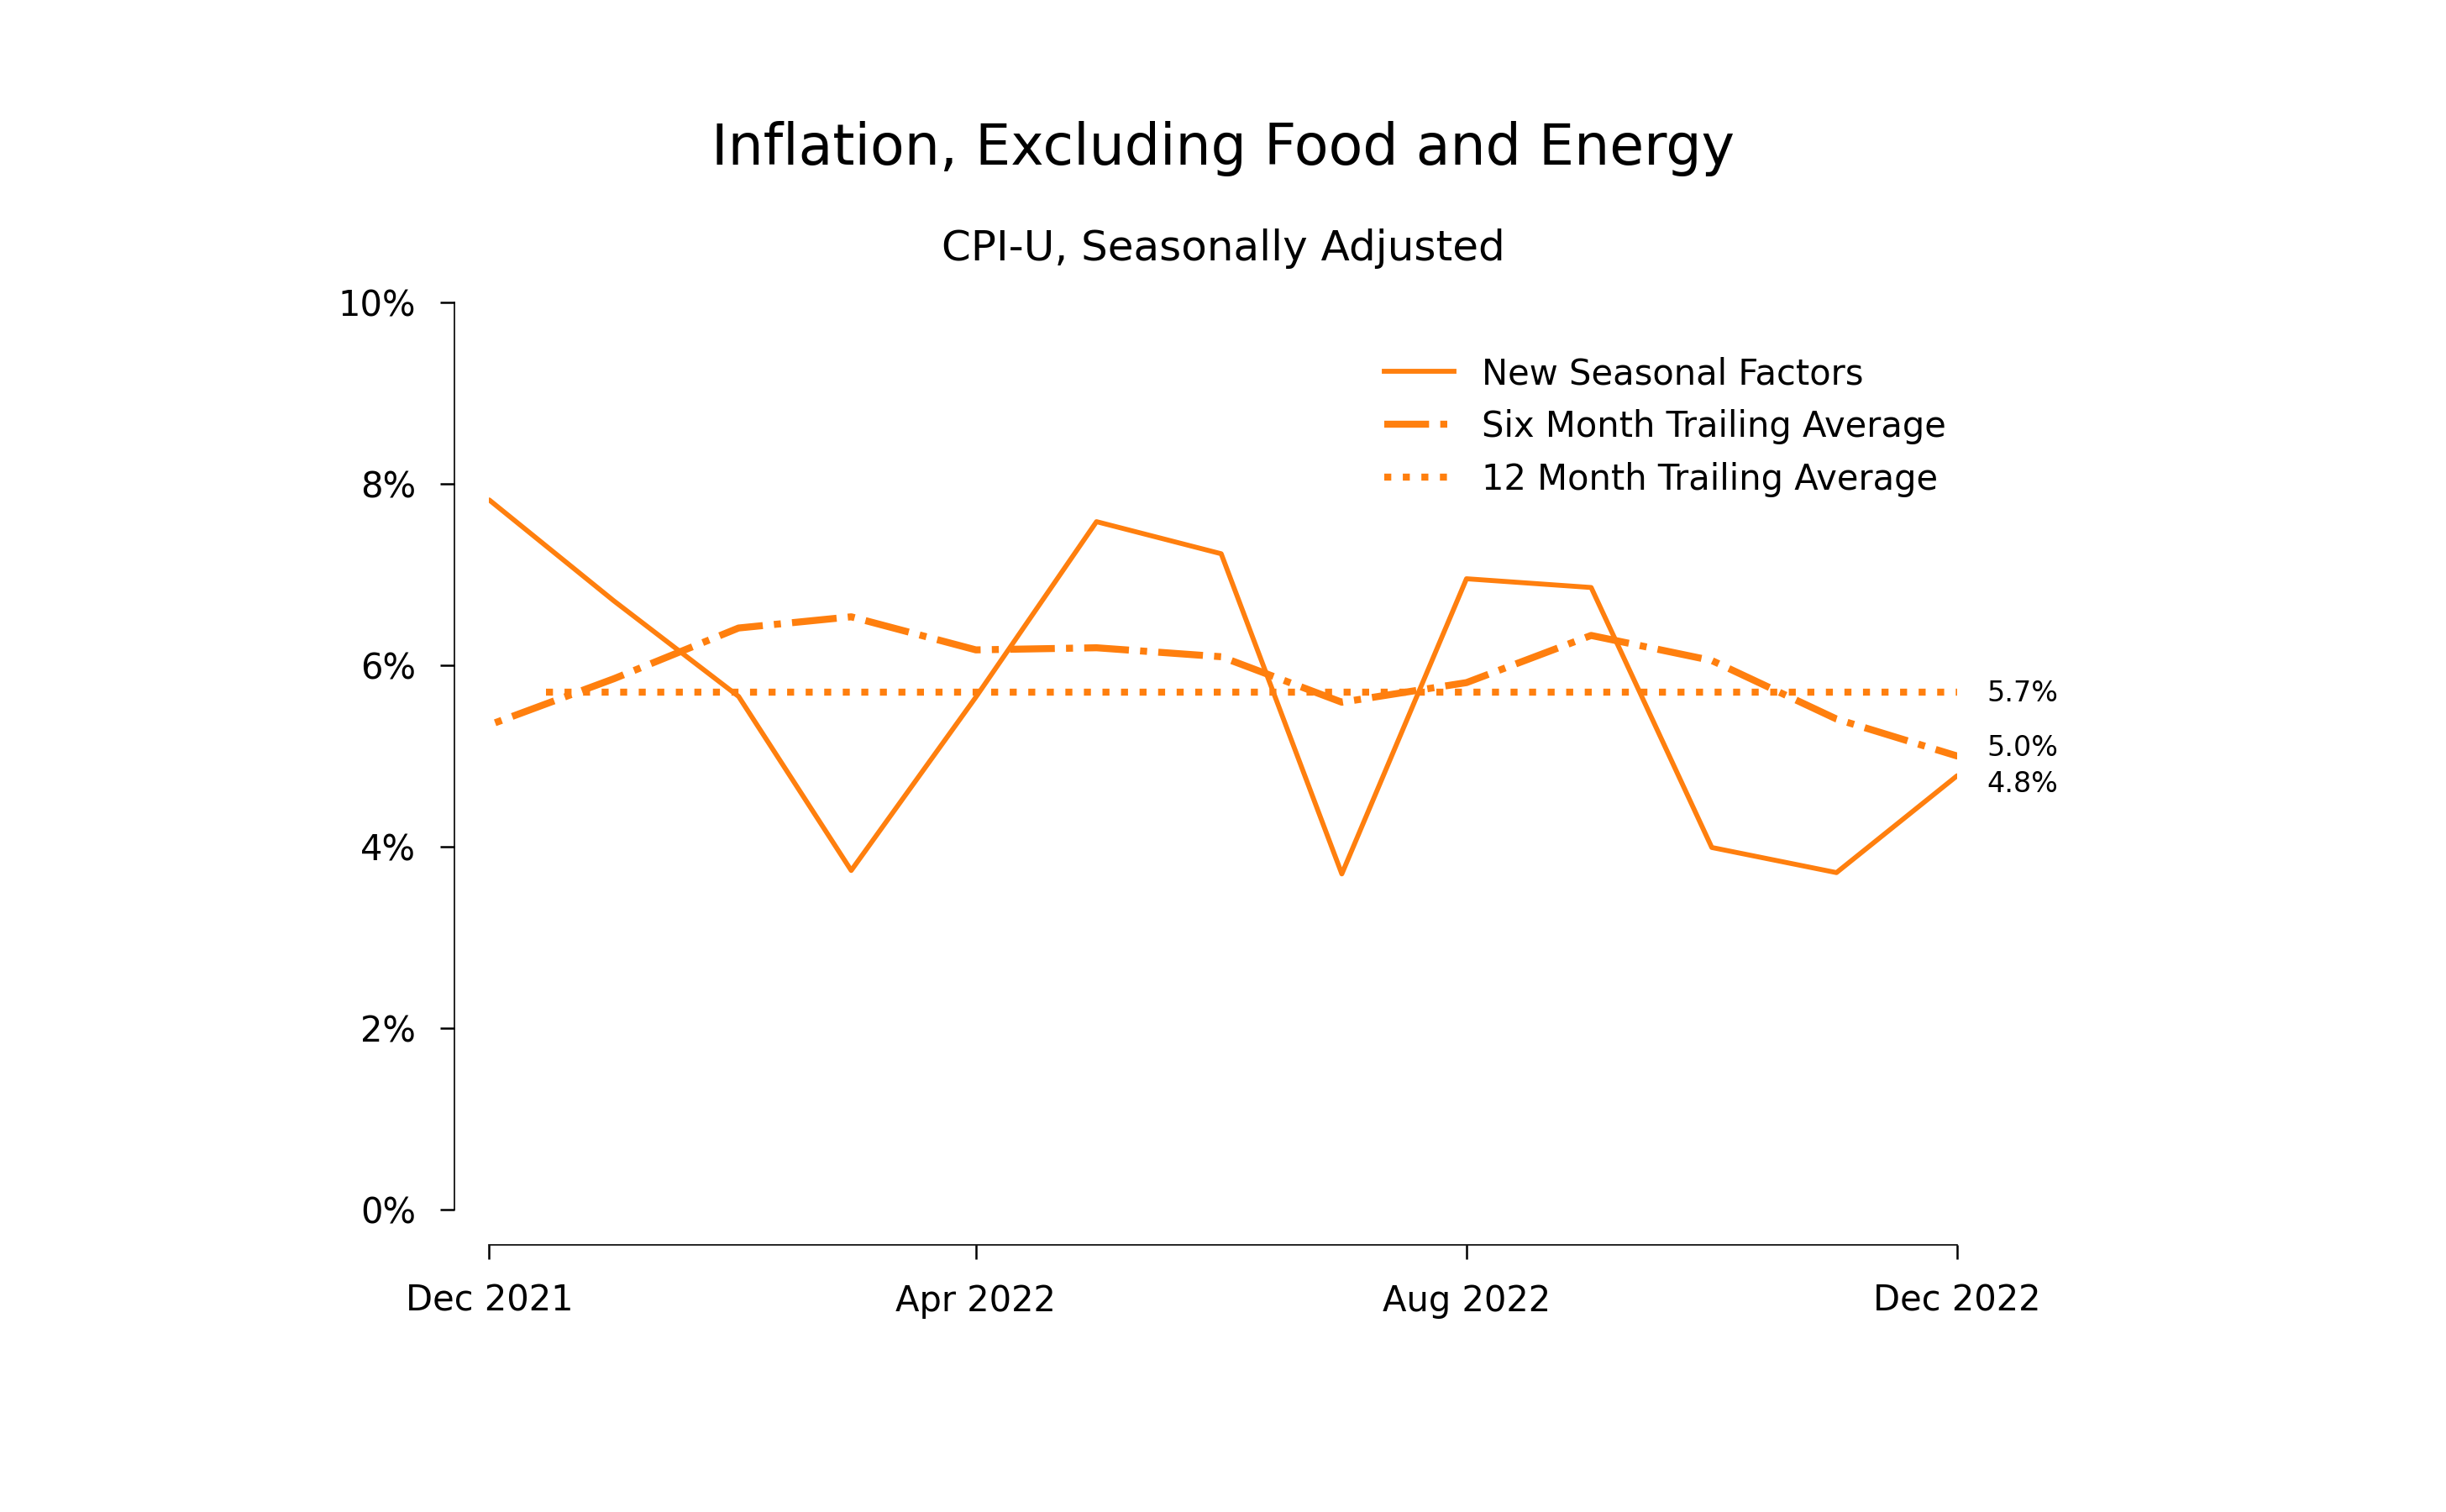
The changes are big. Using the old adjustment factors, the seasonally adjusted index for CPI-U less food and energy increased at an annualized rate of 3.1% during the last quarter of 2022. Using the adjustment factors, it increases at an annual rate of 4.2%, an increase of 110 basis points.
A quick look at the raw monthly inflation estimates suggests that while there may be some seasonal patterns, in a noisy and evolving world, it will be very hard to estimate them with confidence. And I don’t like surprises. So henceforth, I’ll just stick with the unadjusted data.
Even without knowing what seasonal effects are present, there is a safe way to see if the inflation rate has come down: compare unadjusted values in the same months of the year. Using the not seasonally adjusted CPI-U less food and energy, the average rate of increase for the months of October, November, December and January, was 6.5% in 2021–2. In 2022–3, the average for the same four months was 3.5%—down by 300 basis points.
When I first wrote about inflation last December, it seemed to me then that it was more likely than not that inflation had decreased to a surprising extent. With two additional months of data, the odds of a decrease seem even higher now.
Things could change. In macroeconomics, nothing is certain. But if economists could stop worrying so much about the message we send to the public and focus instead on the evidence, it might be time to start taking seriously the possibility that inflation has decreased by roughly 300 basis points in the last six months. At a minimum, it is time to look beyond the familiar 12-month average inflation rates because they mask any big changes that might occur in the last 6 months.
The difference that the revisions make
The next two graphs show the effect of the change in seasonal adjustment of the CPI-U. The first is the graph I published in January. It plots data that were seasonally adjusted using the old adjustment factors. (See the notes at the end for more detail on the data.) There is a lot of variability in the month-to-month numbers, but after May, the solid line does look like it is headed down.
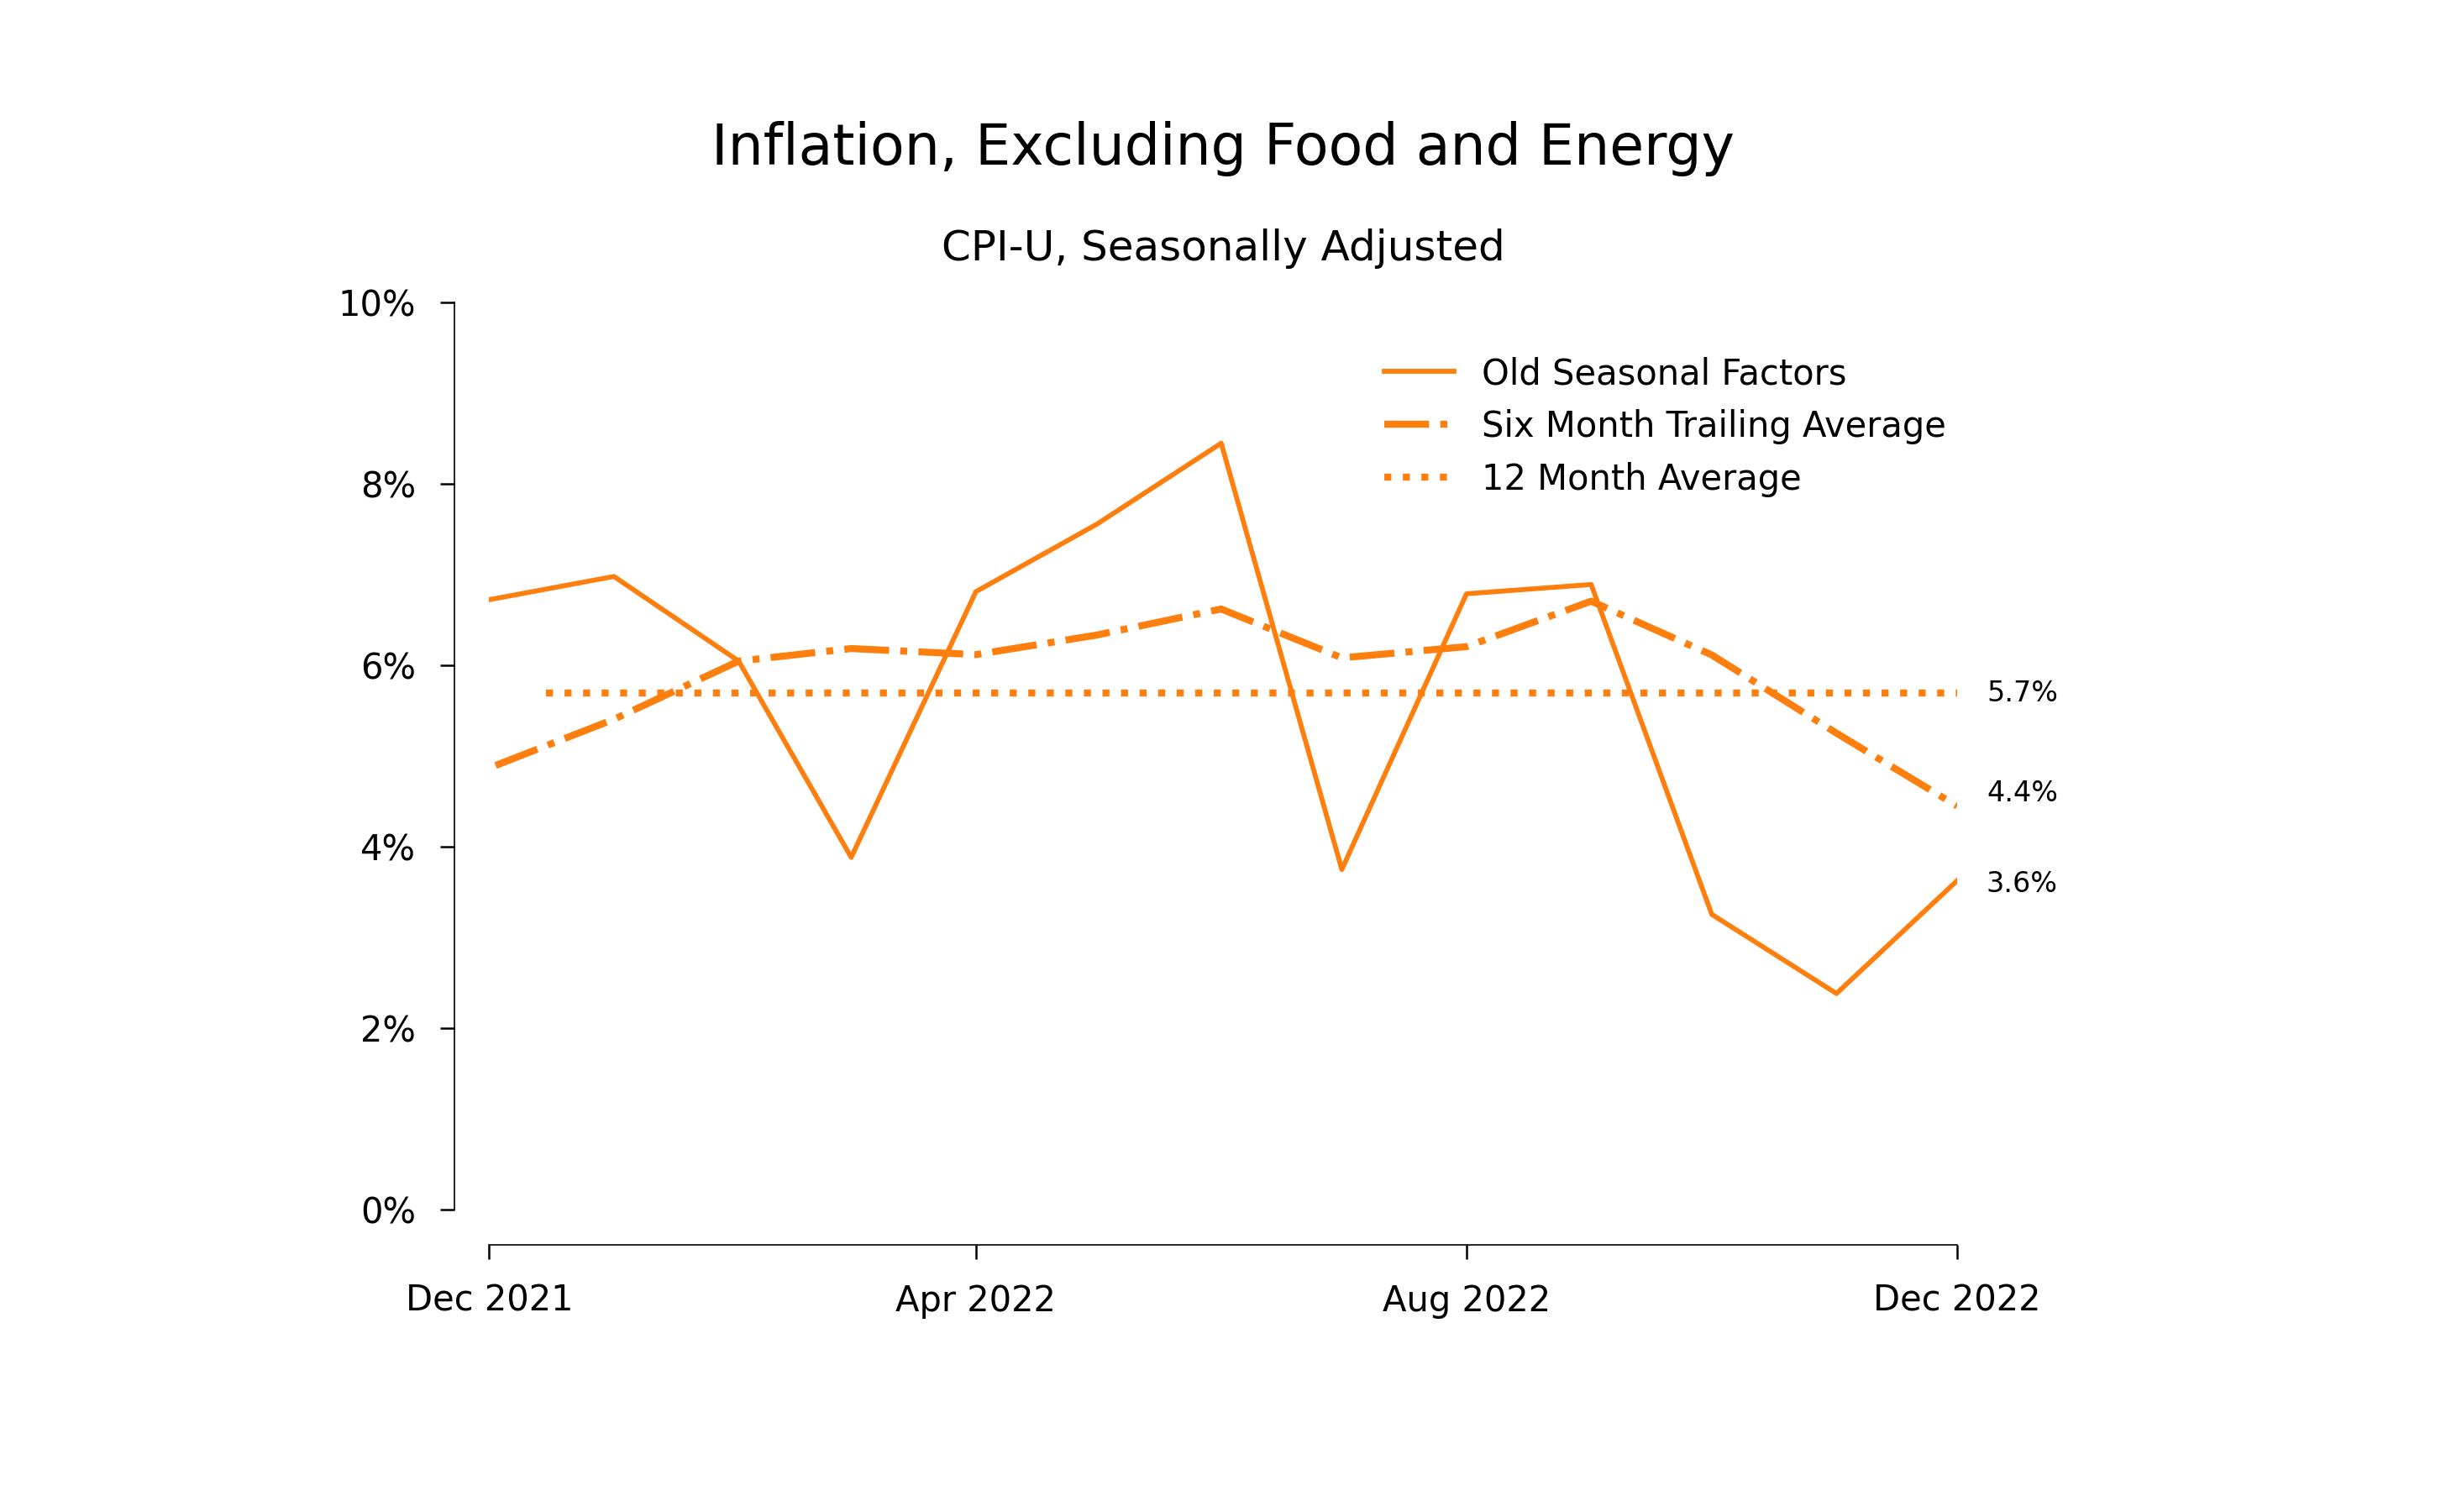
The second graph is exactly the same except that it uses data that were adjusted using the new seasonal factors. The difference is obvious. The trend in the solid line is gone.
In his column published online on Mar 4, Paul Krugman comments on a similar effect that shows up for a different version of the CPI-U (apparently the all-items version.) Using the eyeball test, the change to the index that excludes food and energy is even more dramatic.
Krugman’s main point is that there is a lot of uncertainty about the inflation rate. I agree. In particular, because we do not know the right seasonal adjustment, we don’t know how to infer a 12-month inflation rate from rate calculated over the last four months.
Nevertheless, we can conclude from the unadjusted data that inflation decreased by a substantial amount during the last quarter of 2022. Four months not very long. Things could change. We shouldn’t overreact, but we should recognize what the data show.
The unadjusted data
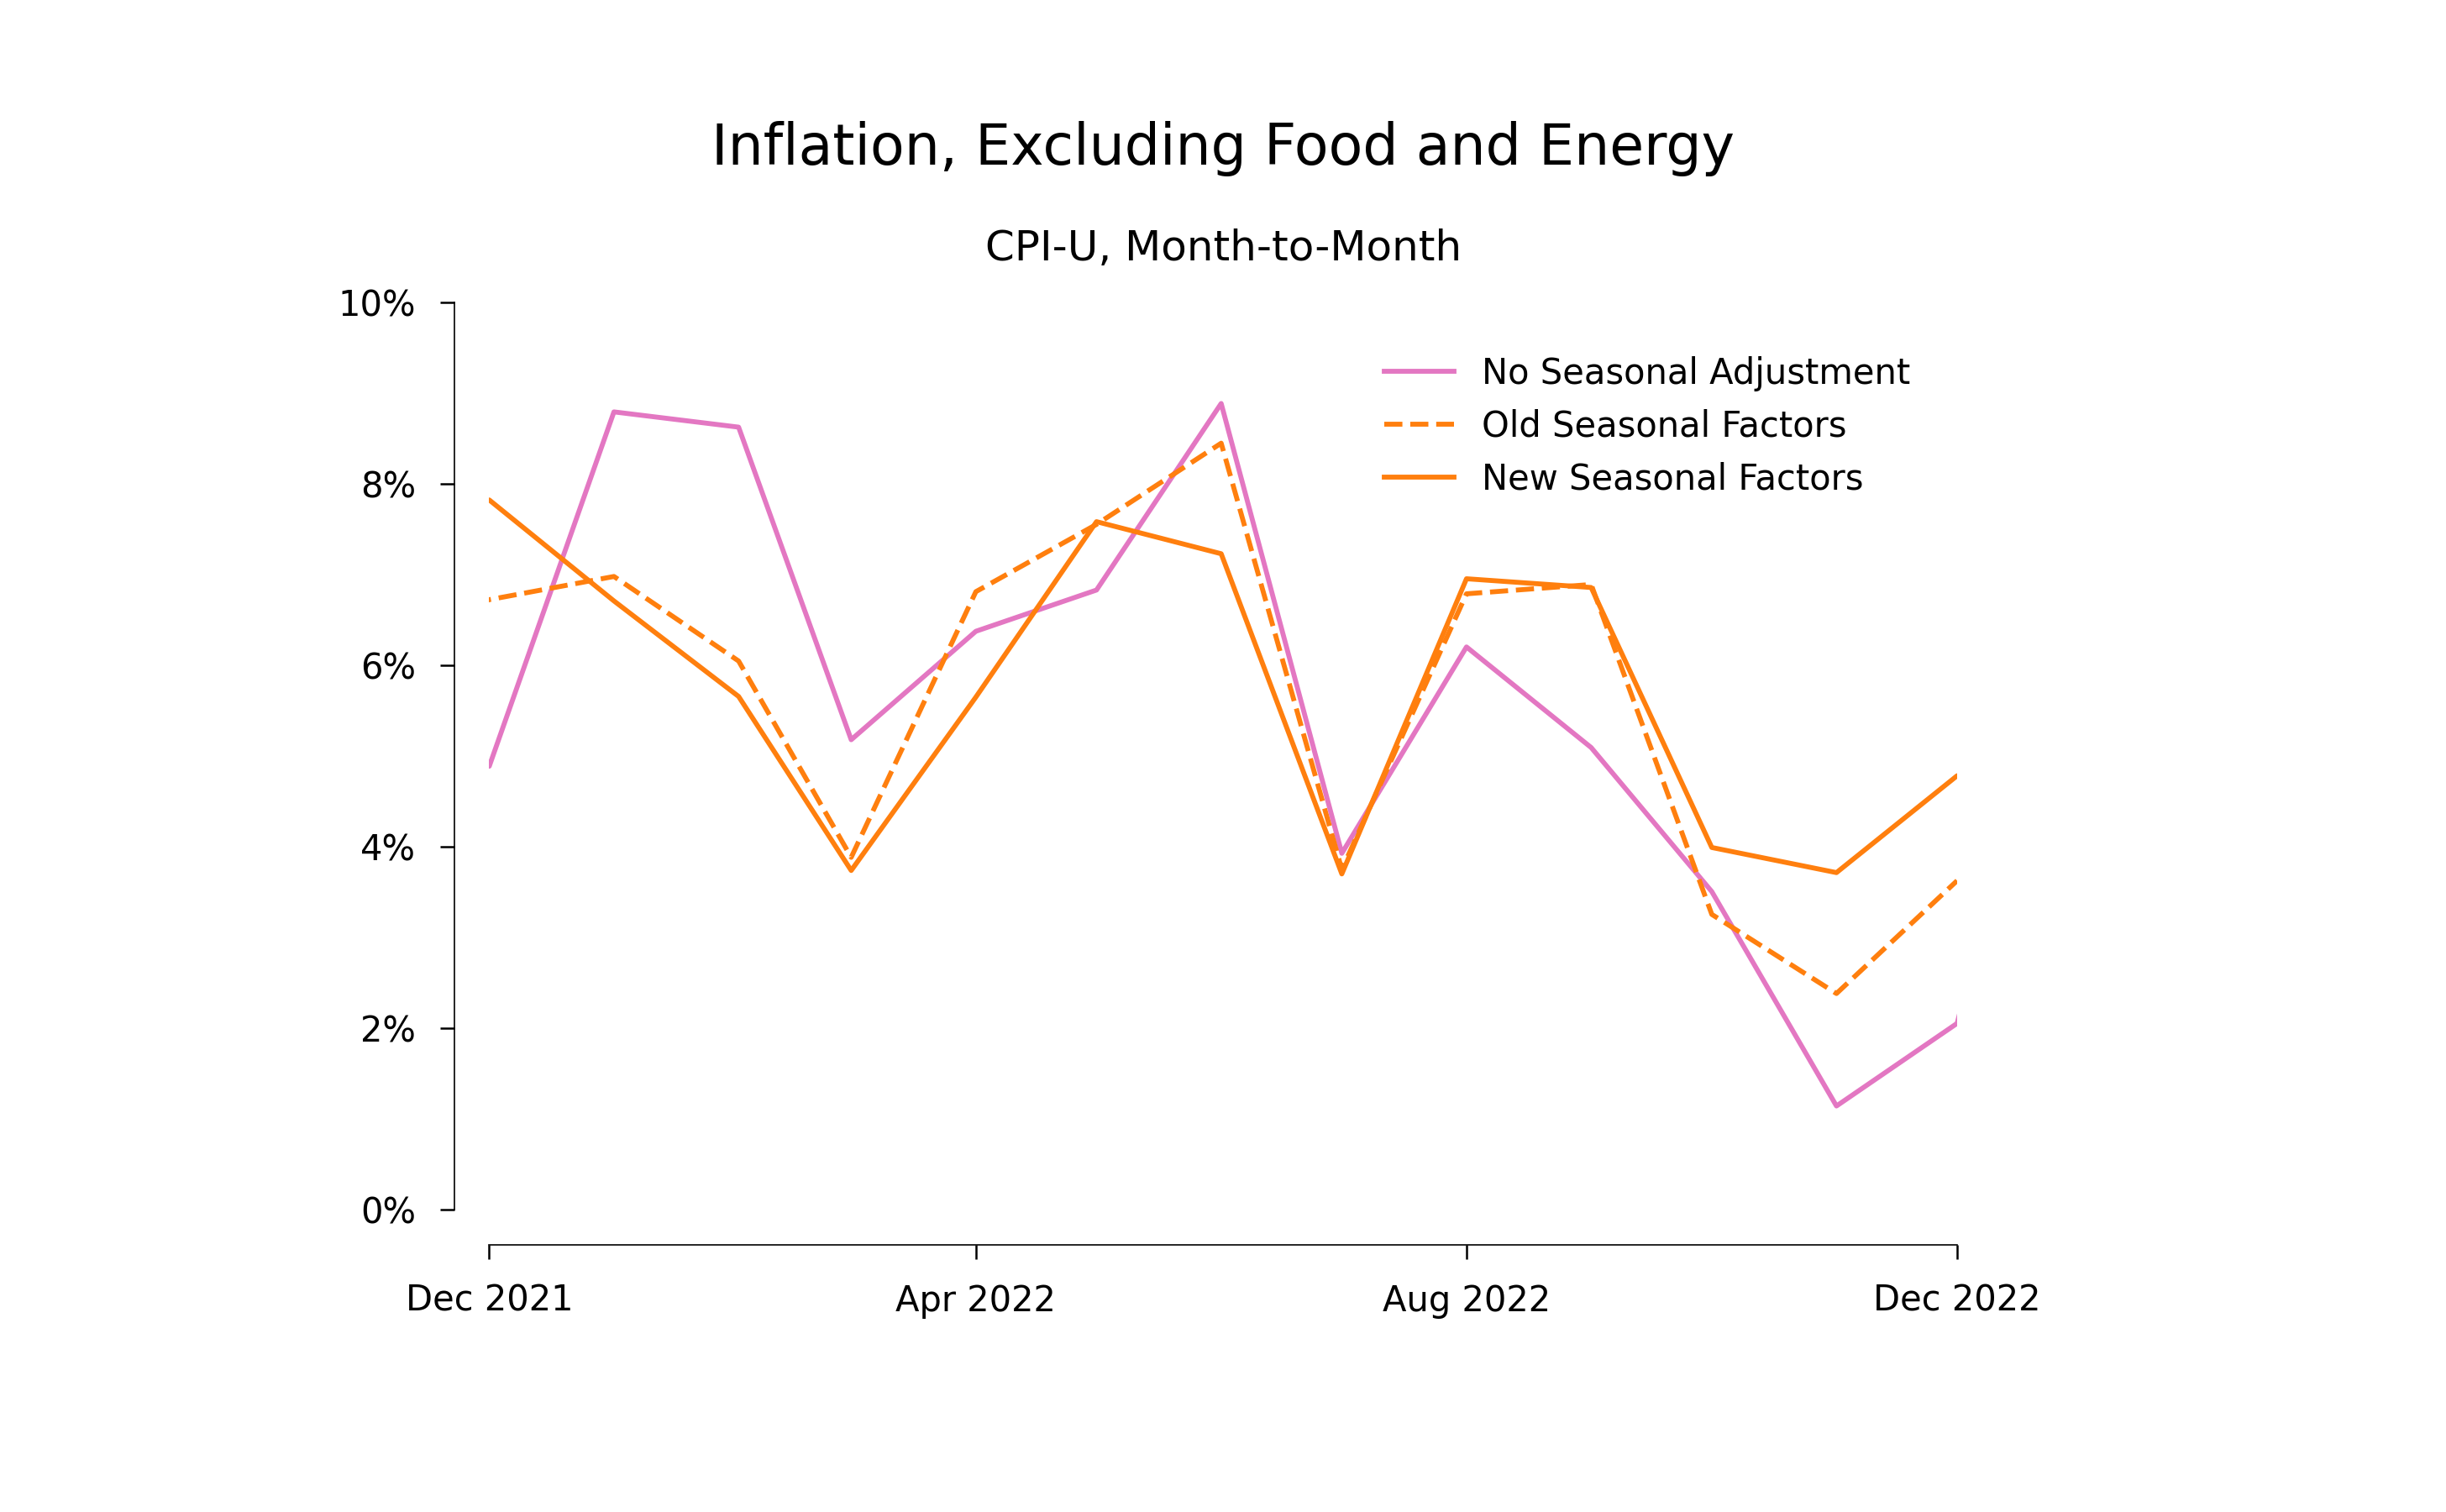
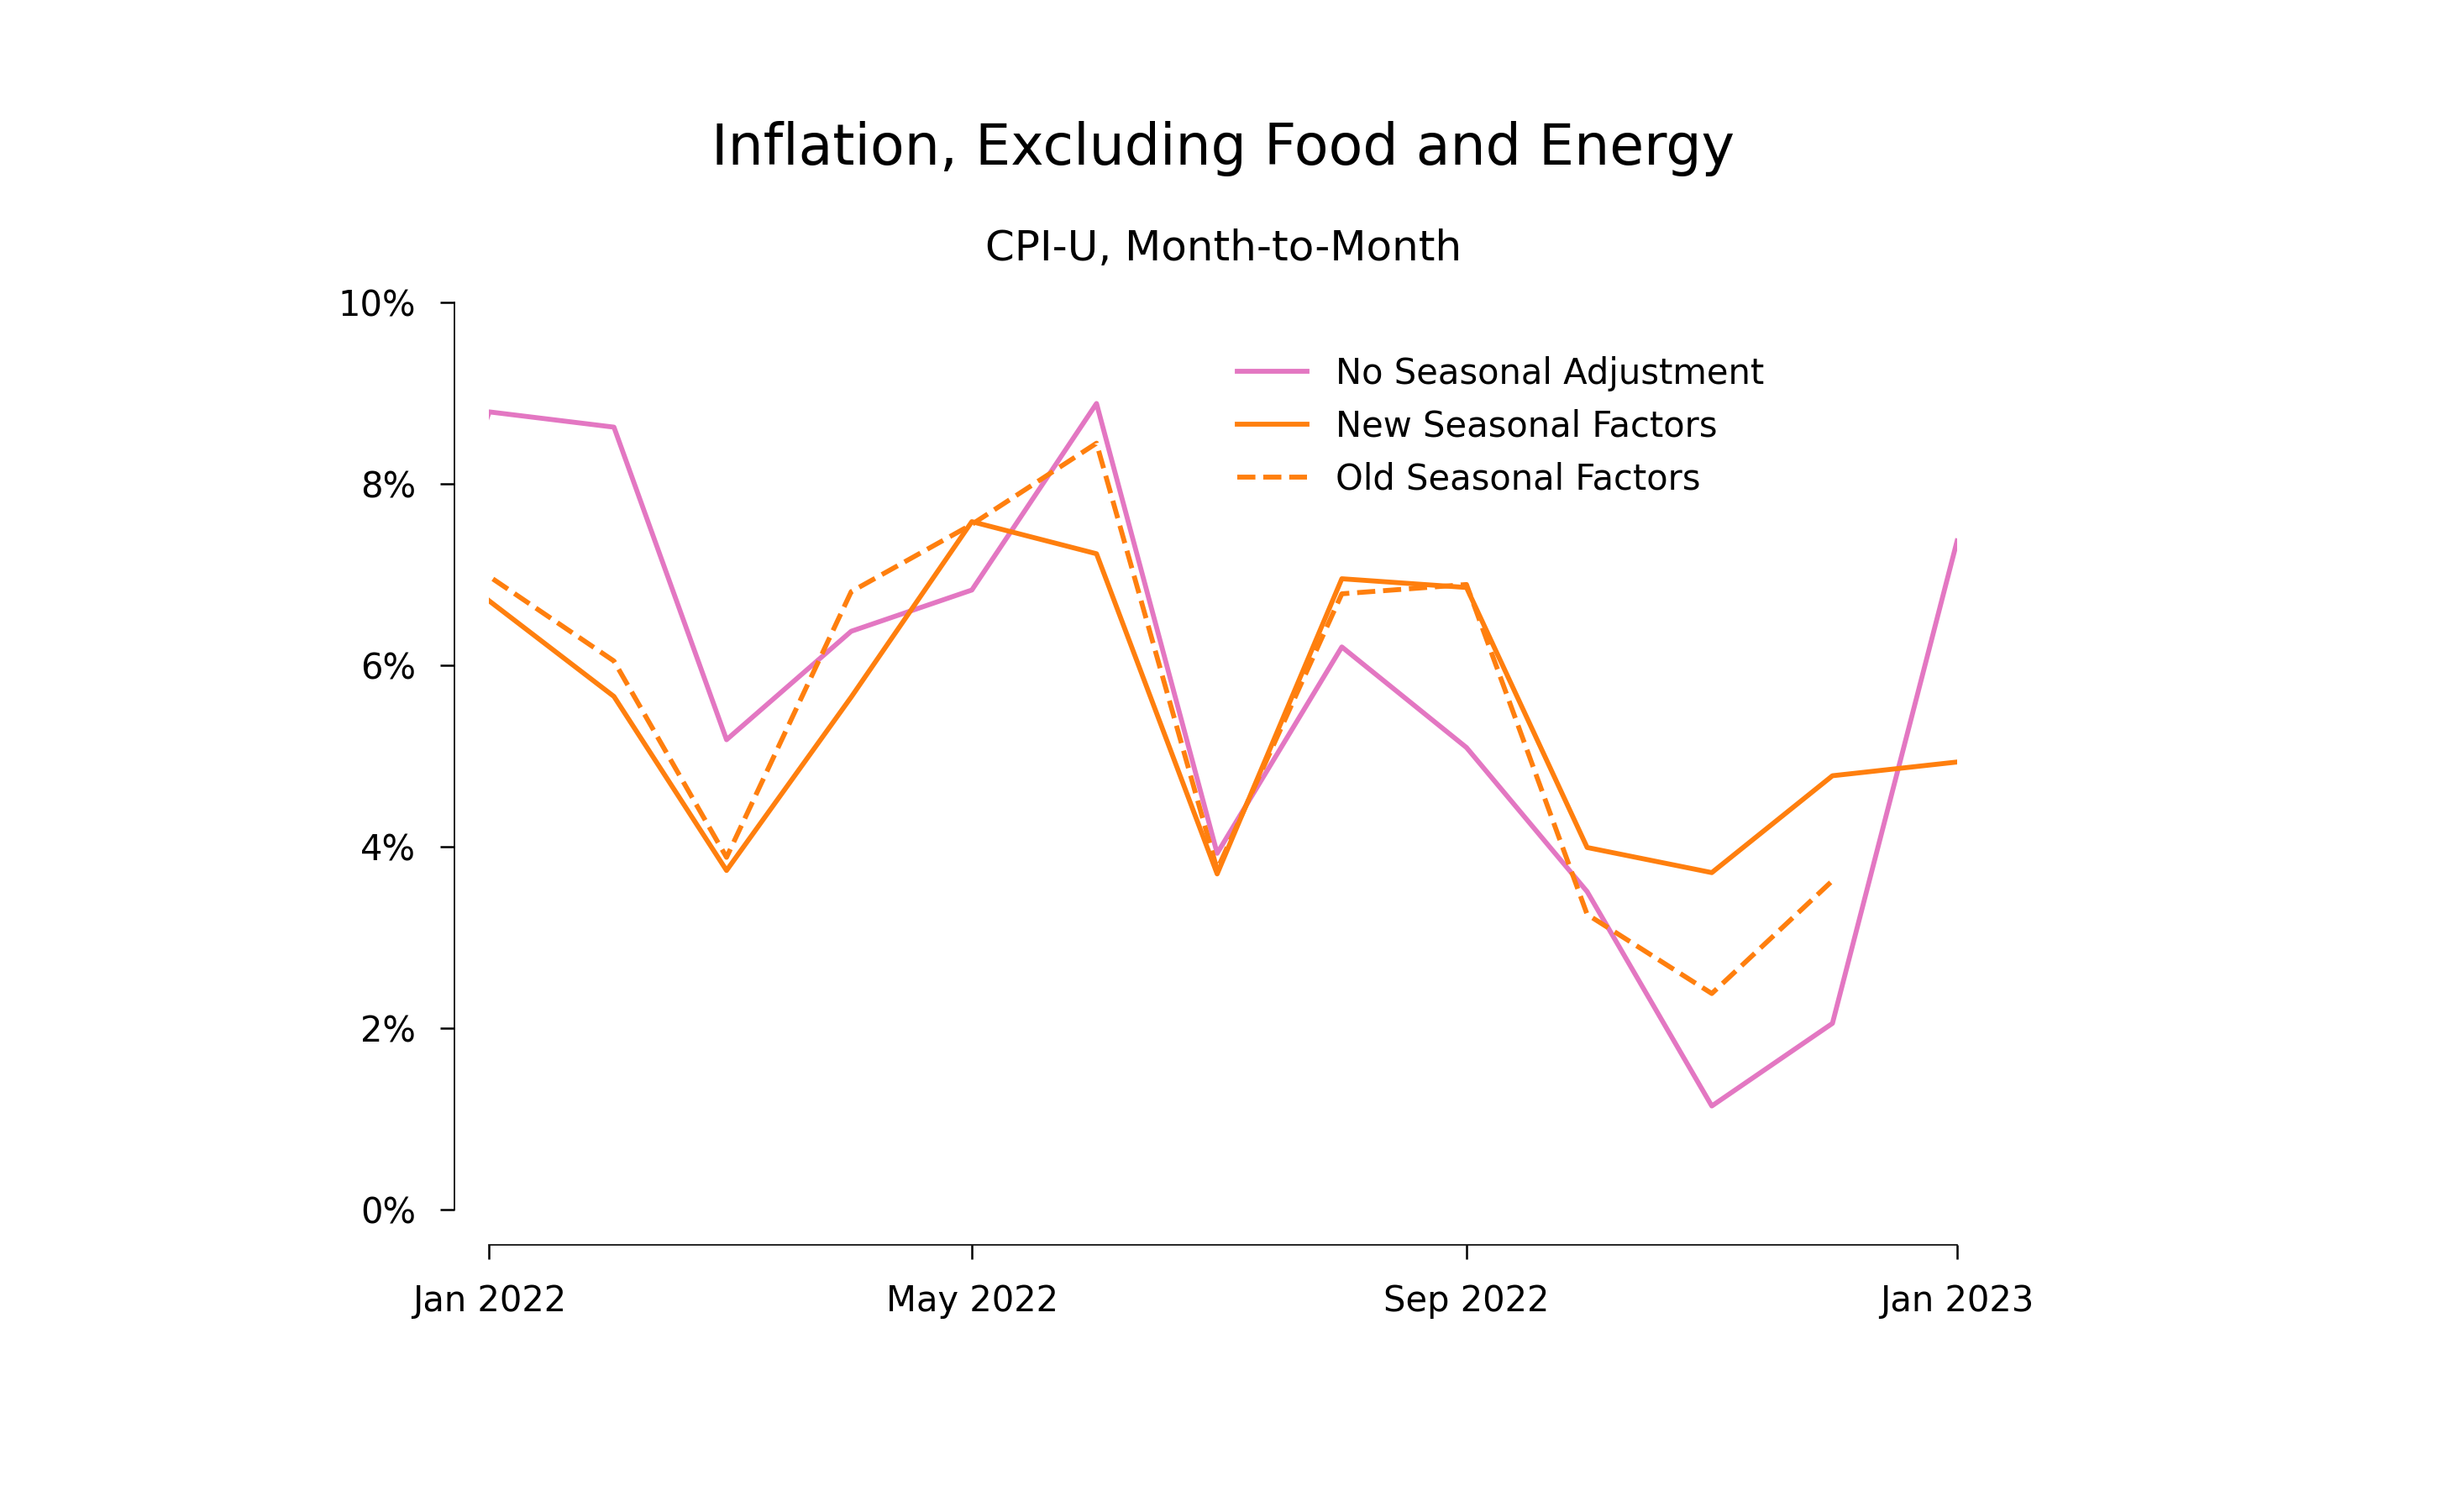
Using the same scale on the horizontal axis, the next figure shows the unadjusted month-to-month changes in the CPI-U less food and energy and the two seasonally adjusted series. The unadjusted data show an even bigger downward trend after May 2022. The old adjustments took away part of the trend. The new adjustments take away even more.
Is there a general tendency for the monthly inflation rates to decline over the course of the year? Is this downward trend something that seasonal adjustment should remove? That’s not what the next two graphs showing the previous two years suggest to me:
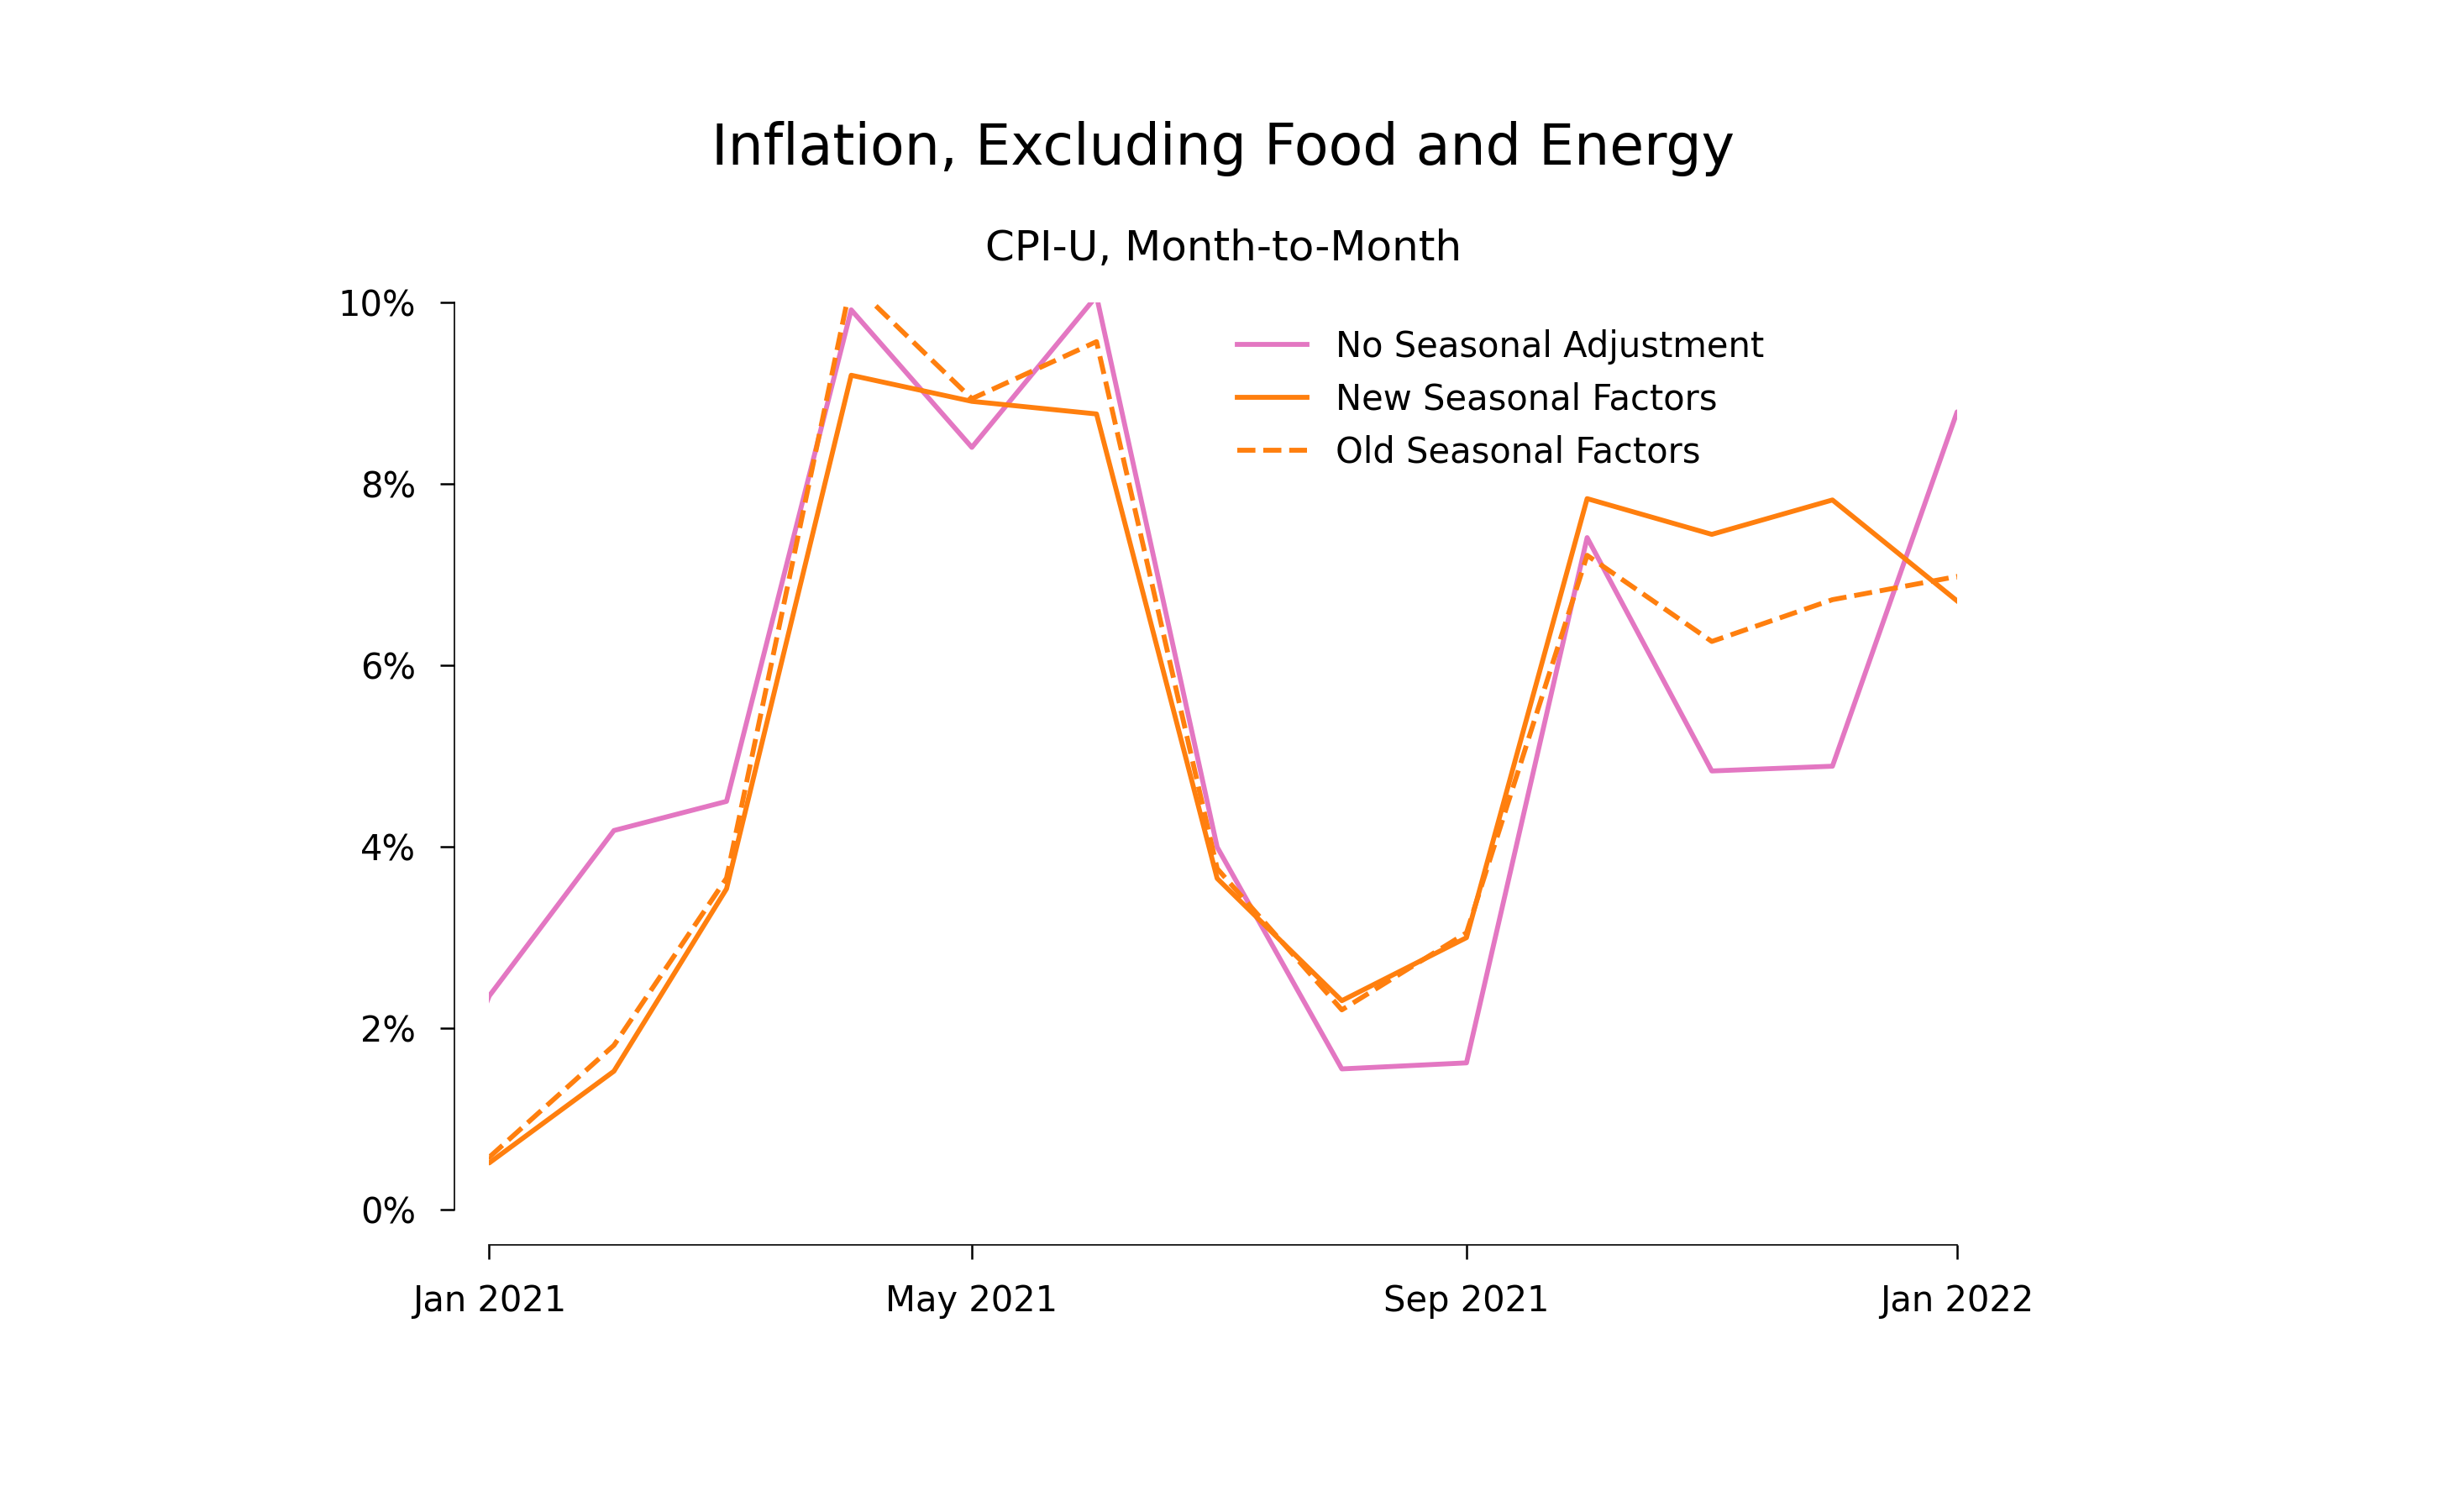
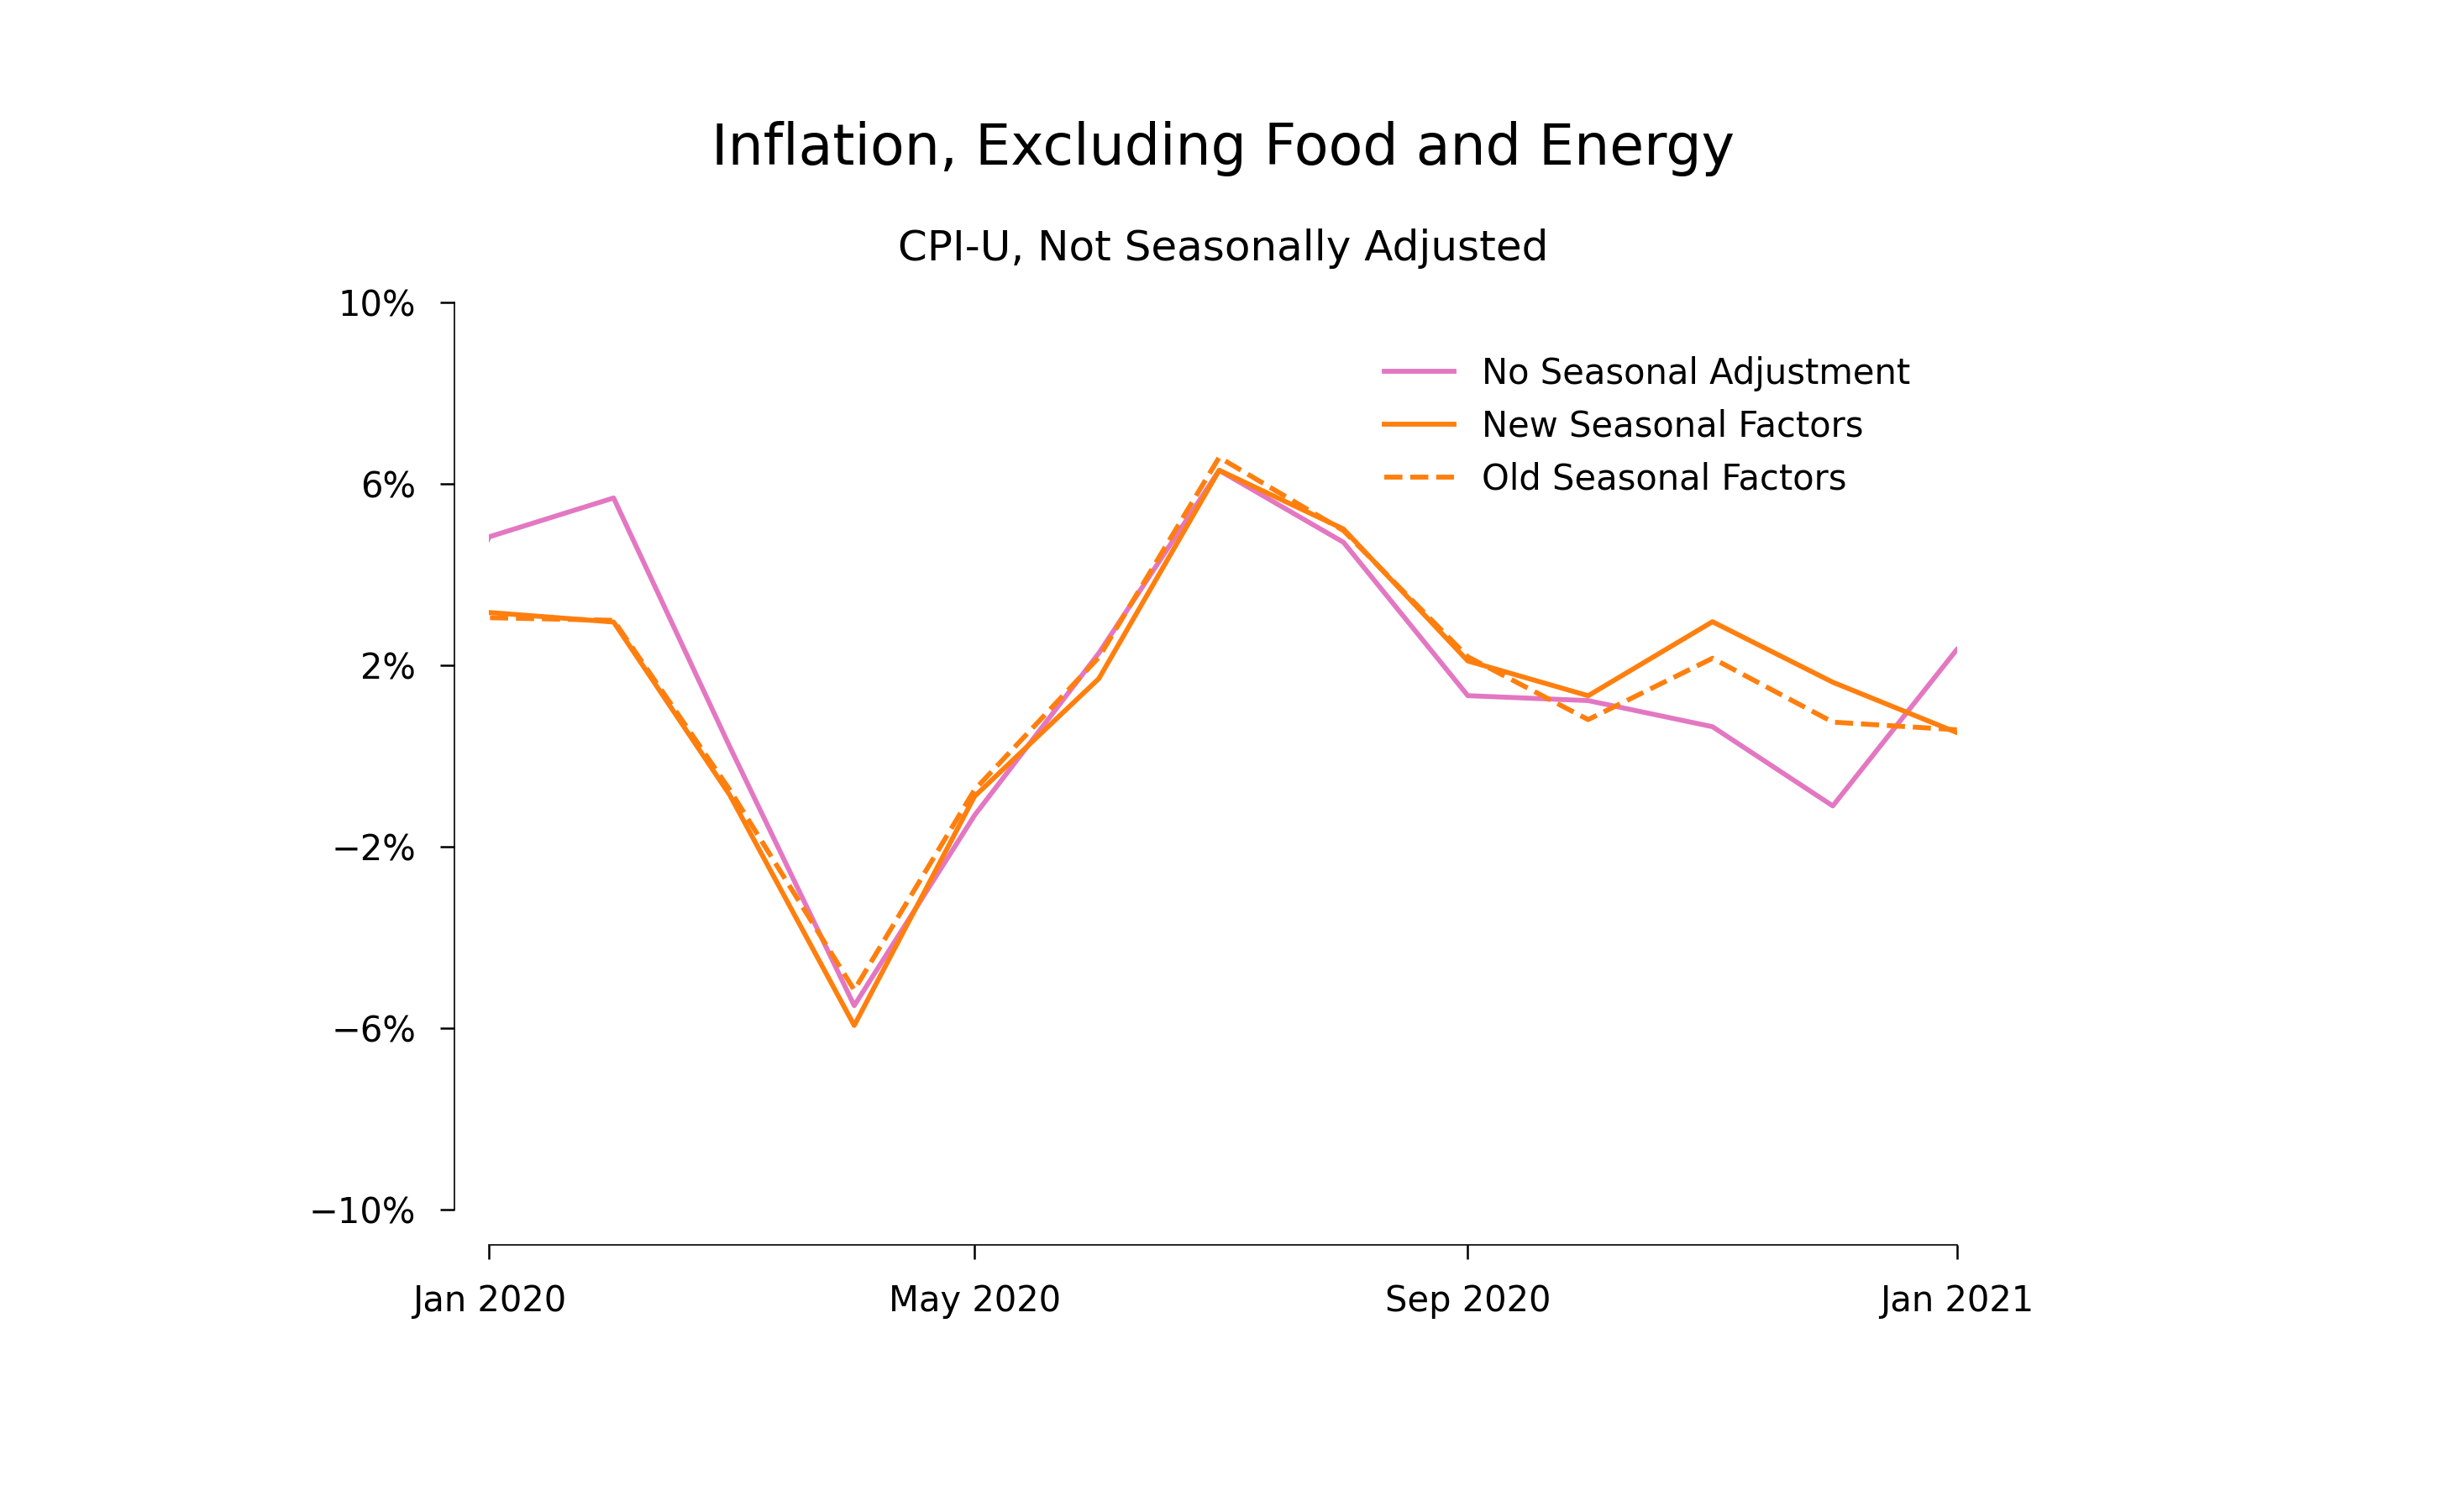
Notice that the vertical scale for this last graph is twice as big as in the other graphs.
There is one indication of a calendar effect does seem to be apparent in these graphs. Prices seem to go up by more in January. The graphs for 2021 and 2020 both show an uptick in January. Once I change the dates for the graph for 2022 so the horizontal axis runs from January to January, this is also clear for 2022:
We do not know the true pattern of seasonal effects
There may be seasonal effects, but the graphs in the previous section suggest that the world we live in is noisy and evolving, which means that we can’t estimate these seasonal effects with any precision. The people at the BLS presumably thought that the old seasonal adjustments were plausible; now they presumably think that the new ones are at least as plausible. Yet the two different estimates of seasonal effects yield monthly inflation rates that differ substantially.
Nevertheless, inflation decreased
Even if there are seasonal effects, we can calculate unbiased estimates of the change in inflation between two intervals that span the same calendar months.
During the last quarter of the year, the unadjusted data show that prices increased at an annualized rate of 5.7% during 2021 versus 2.2% during 2022—a reduction by 350 basis points.
If we look at January alone, the drop in inflation that is smaller. The index increased at an annual rate of 8.8% during January 2022 versus 7.4% during January 2023—a reduction by 140 basis points.
Taking all four of the most recent observations (October, November, December and January) and comparing them with the same period one year ago, prices increased at the annualized rate of 6.5% during 2021–2 and 3.5% during 2022—a reduction by 300 basis points.
The drop shows up only in the last part of 2022. If we compare the rate of change of prices over February, March, April, and May, it is the same to two decimal points in 2021 and in 2022, 6.75%.
On the basis of the data from the last four months, my estimate of the change in inflation after September 2022 is -300 basis points. In the same units, my subjective uncertainty interval is something like (-400, 100).
What to do now?
As Krugman says, there is a lot of uncertainty, including uncertainty about seasonal effects that caught me off guard. So it is not time to do anything rash. But we should keep an open mind as we wait for more data.
And as Krugman suggests, while we wait and watch, it would help if we could pick a few specific measures of the price level and stick with them so that the conversation stays focused on the information conveyed by new data.
I realize that it looks hypocritical for me to call for no more changes to our measure of inflation after recommending that we stop using seasonally adjusted data. But in this case, the BLS forced the issue, and having now looked into the unadjusted data, the objective case for avoiding the seasonal adjustments seems obvious. The right response now is to compare the unadjusted data from same months in different years.
Notes:
1. Unadjusted Data
The BLS ID for the inflation index that I’m using for the unadjusted monthly value of the CPI-U index less food and energy is
Series Id:    CUUR0000SA0L1E

Not Seasonally Adjusted
Series Title: All items less food and energy in U.S. city average, all urban consumers, not seasonally adjusted
Area:         U.S. city average
Item:         All items less food and energy
Base Period:  1982-84=100
For the calculations reported here, I used a file downloaded on Mar. 3.
2. Seasonally adjusted data
My seasonally adjusted series is
Series Id:    CUSR0000SA0L1E

Seasonally Adjusted
Series Title: All items less food and energy in U.S. city average, all urban consumers, seasonally adjusted
Area:         U.S. city average
Item:         All items less food and energy
Base Period:  1982-84=100
For the data based on the old seasonal adjustment factors, I’m using a file for CUSR0000SA0L1E that I downloaded in January. I do not know if it is still possible to download a version of that file from the BLS website.
For the data that uses the new seasonal adjustment factors, I’m using a file for CUSR0000SA0L1E that I downloaded on Mar 3, 2023.
3. Annualized inflation rates
For any price index P, the annualized rate of inflation ||\pi_t|| for month ||t|| is ||12|| times the difference between the log of the index in that month and the log of the index in the previous month:
$$\pi_t = 12* (ln(P_t) - ln(P_{t-1}))$$
The annualized rate of change of prices over the three months October, November, and December is the arithmetic average of the 3 monthly annualized rates. The calculation for the four months October–January is the arithmetic average of the 4 monthly annualized rates.