The Deep Structure of Economic Growth
When I was working on growth in the 1990s, I wrote an article on the economic growth for an encyclopedia of economics. (The links here take you to a version of this article that I updated in 2016.) My goal was to provide an accessible introduction to our understanding of growth without shying away from its deep conceptual foundations.
- We can share discoveries with others.
- There are incomprehensibly many discoveries yet to be found.
The jargon for the is the "nonrivalry of knowledge;" for the second, "combinatorial explosion."
I've been pleasantly surprised about how well it seems to have served its intended purpose. Non-economists have said that it helped them understand why unlimited growth is possible in a world with finite resources. Professional colleagues have been intrigued by the discussion of combinatorial explosion its interaction with nonrivalry. Specialists and non-specialists have latched onto its discussion of meta-ideas; ideas about the discovery of ideas.
And by the way, it shows that if we treated Shenzhen as a city state analogous to Singapore, it would have the fastest rate of GDP growth ever observed. It takes sustained growth at a rate of more than 20% per year to increase output by 1000 fold in 30 years.
Compounding
In an update on an old story, an investment banker asks the client to pay by placing one penny on the first square of a chessboard, two pennies on the second square, four on the third, doubling the number on each square that follows. If the banker had asked for this on only the white squares, the initial penny would double thirty-one times to $21,474,836 on the last square. Using both the black and the white squares, the sum on the last square is $92,233,720,368,547,758.
People are reasonably good at estimating how things add up, but for compounding, which involved repeated multiplication, we fail to appreciate how quickly things grow. As a result, we often lose sight of how important even small changes in the average rate of growth can be. For an investment banker, the choice between a payment that doubles with every square on the chessboard and one that doubles with every other square is more important than any other part of the contract. Who cares whether the payment is in pennies, pounds, or pesos? For a nation, the choices that determine whether income doubles in one generation or two dwarf all other economic policy concerns.
Growth in Income per Capita
A rough guide to the doubling time for any rate of growth is to divide it into 70. For example, if something grows at 7% per year, you can infer that it doubles every 10 years because 70 / 7 = 10. If it grows at 3.5% per year, it takes 20 years to double. Taking twice as long to double may not sound so bad, but remember the difference between using just the white squares or all the squares on the chessboard. Or consider what happens over the course of a century. A doubling time of 20 years means doubling 5 times in a century, which produces an increase by a factor of 32. Doubling 10 times produces an increase by a factor of 1024.
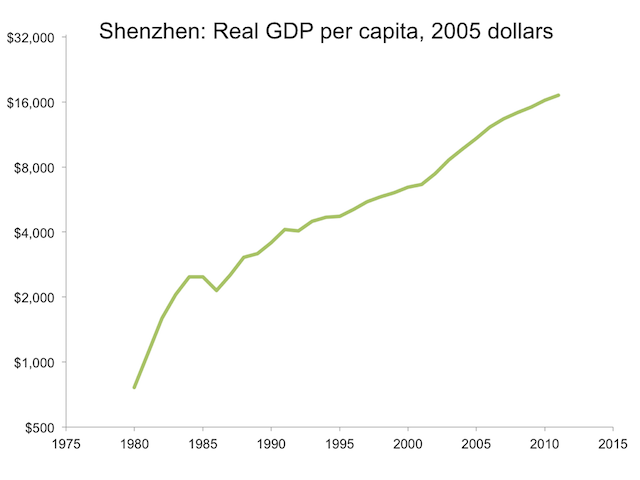
Is growth at 7% per year even possible? For a country that starts at a low level of income, we now know that growth this fast can be sustained for decades. Figure 1 shows GDP per capita in Shenzhen, a new city that the national government in China started as a reform zone where it could pilot controversial new policies such as letting foreign firms enter and hire Chinese workers. When a graph has a ratio scale on the vertical axis, as this figure does, the slope of a plotted line is equal to the growth rate. The steeper slope from 1980 to 1985 shows that growth was higher then. In this exceptional initial period, it grew at an exponential rate of 23% per year. In the subsequent interval from 1985 to 2011, it grew at more than 7% per year. Growth at this pace lifted GDP per capita (measured in the purchasing power of a dollar in 2005) from about $2500 in 1985 to about $17,000 in 2011.
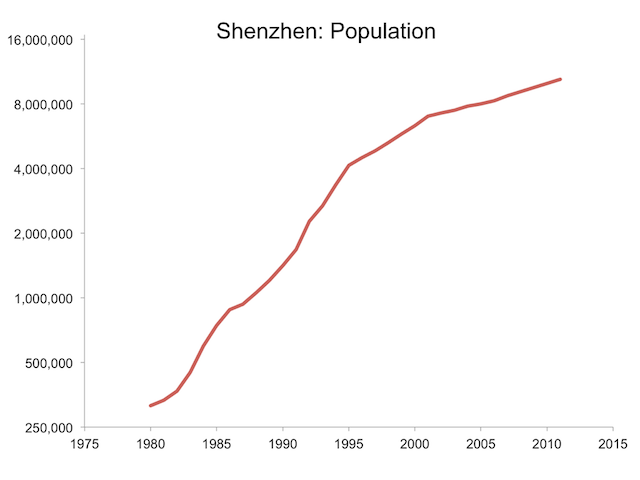
Figure 2 shows that Shenzhen’s population also grew rapidly, at an average at the rate of 11% per year, increasing from about 300,000 in 1980 to more than 10 million in 2011.
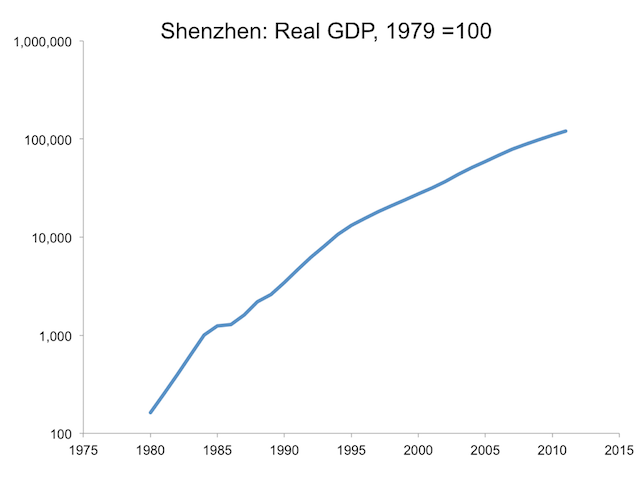
Figure 3 plots total GDP, which is the product of GDP per capita and population. Over these 26 years, it grew at an average rate of 21% per year, increasing by a factor of about 750. Taken together, these graphs vividly demonstrate that growth can take place at a faster pace than we realize, and faster growth cumulates quickly into big changes in standards of living for large numbers of people.
Growth rates for nations drive home the point that modest changes in growth rates are possible and that over time, these have big effects. Over the same interval, 1980-2011, the average growth rate of GDP per capita for all of Chinese was 5.8% per year. It started at about $1500 (again, in the purchasing power of dollars in 2005). By 2011, it had increased nearly six-fold to $8900. Compare its experience in India’s. In 1980, GDP per capita started at about $1100. Over the same interval, its growth averaged 4.1%, which raised GDP per capita to $4000, for an increase by a factor of 3.6. The difference between 5.8% and 4.1% seems small compared to the difference between an increase by a factor of 6.0 instead of 3.6.
When I was growing up, I was told to eat my dinner because “children are starving in China.” Then, prospects for China looked dismal, far worse than for Africa, India, or Latin America. The changes that have followed from the opening-up reform in China have astonished everyone. One very positive effect is that people in other countries with low GDP per capita are asking “If China did this, why can’t we?”
The challenge for growth theory is to understand why growth in China was so much faster after reform than before (5.8% per year from 1980 to 2010 versus 2.4% per year from 1955 to 1980); why growth in China was faster than in India (5.8% versus 4.1%); and what the answers to the these questions tell us about options for increasing growth everywhere.
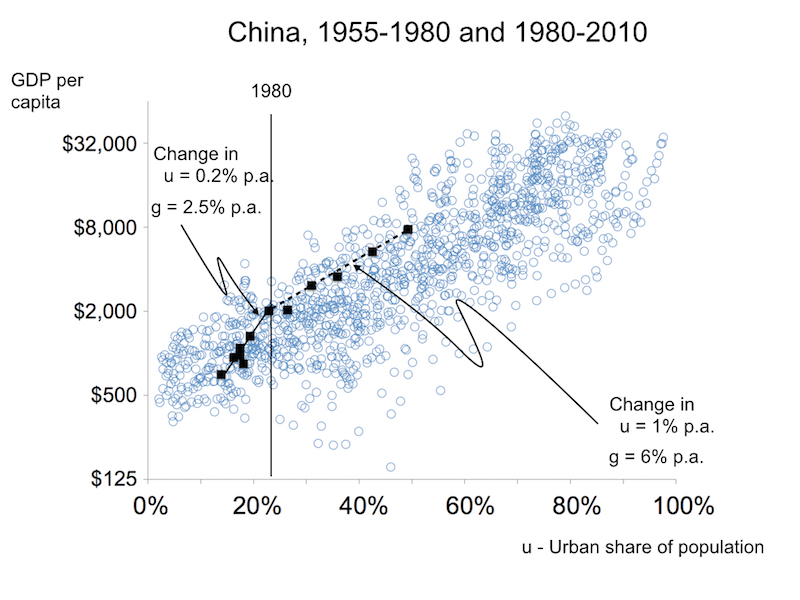
Figure 4
Figure 4 suggests one direction that I am now pursuing. The black squares for China are observations taken every 5 years from 1955 to 2010, on GDP per capita and the share of the population that lives in cities. These squares start moving up and to the right at a faster pace after 1980.
The cluster of points in the background show observations on GDP per capita and the urban population share for all other countries in the world, with observations taken every five years. (For more detail on these data, see here.) Points in the scatter diagram show that across countries and over time, higher income is correlated with higher urbanization. The experience in China shows that the increase in the rate of growth of GDP per capita coincides with an increase in the pace of urbanization. These correlations do not prove a causal connection, but they do point to a connection that growth theorists should understand.
Recipes
No matter the optimistic signs from experience in recent decades, our intuition about resource constraints suggests that eventually, growth cannot be sustained. Yet when we look at data for as far back as we can go, here too we see that growth rates can increase and have big effects over time on standards of living.
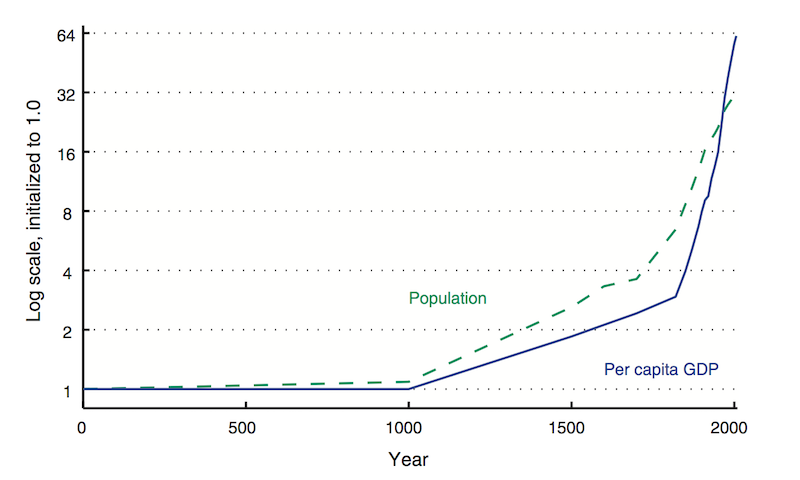
Figure 4
Figure 5 shows estimates of GDP per capita and population in regions that today make up the United States and 12 European nations. Once again, because of the ratio scale on the vertical axis, the slope tells you the rate of growth. Over the centuries, the rate of growth of GDP per capita has increased. Moreover, as in Shenzhen, it has increased despite a large increase in the population. (For most of this time interval, the rate of growth of population increased, but in the last few decades, it has started to decrease so rapidly that the population is likely to stabilize in the coming century, and may even start shrinking.)
To understand how persistent growth, even accelerating growth is possible, it helps to step back and ask where growth comes from. At the most basic level, an economy grows when whenever people take resources and rearrange them in a way that makes them more valuable. A useful metaphor for rearrangement as value creation comes from the kitchen. To create valuable final products, we mix inexpensive ingredients together according to a recipe. The cooking one can do is limited by the supply of ingredients, and most cooking in the economy produces undesirable side effects. If economic growth could be achieved only by doing more and more of the same kind of cooking, we would eventually run out of raw materials and suffer from unacceptable levels of pollution and nuisance. Human history teaches us, however, that economic growth springs from better recipes, not just from more cooking. New recipes produce fewer unpleasant side effects and generate more economic value per unit of raw material.
Take one small example. In many coffee shops, you can now use the same size lid for medium and large paper coffee cups. Before, they each had a separate lid. A small change in the design of the cups means that a shop can serve customers at lower cost. Storeowners need to manage the inventory for only one type of lid. Employees can replenish supplies more quickly.
Big discoveries–the transistor, antibiotics, the internal combustion engine–get most of the attention, but improvements in standards of living also spring from untold numbers of discoveries about something as simple as the shape to use when turning tree pulp into drinking cups.
Combinatorial Explosion
Every generation has perceived the limits to growth that finite resources and undesirable side effects would pose if no new recipes or ideas were discovered. And every generation has underestimated the potential for finding new recipes and ideas. We consistently fail to grasp how many ideas remain to be discovered. The difficulty is the same one we have with compounding: possibilities do not merely add up; they multiply.
In a branch of physical chemistry known as exploratory synthesis, chemists try mixing selected elements together at different temperatures and pressures to see what comes out. We know that humans have been doing this ever since the Bronze Age, because this is how we discovered bronze, a mixture of tin and copper. Later, we found that mixing carbon with iron turned it into the much more useful metal, steel. The search continues. In the late 1980s, researchers found that one of the hundreds of compounds discovered this way—a mixture of copper, yttrium, barium, and oxygen—was a superconductor at temperatures far higher than anyone had previously thought possible. This discovery may ultimately have far-reaching implications for the storage and transmission of electrical energy.
To get some sense of how much scope there is for more such discoveries, we can calculate as follows. The periodic table contains about a hundred different types of atoms. If a recipe is simply an indication of whether an element is included or not, there will be 100 x 99 recipes like the one for bronze or steel that involve only two elements. For recipes that can have four elements, there are 100 x 99 x 98 x 97 recipes, which is more 94 million. With up to 5 elements, more than 9 billion. Mathematicians call this increase in the number of combinations “combinatorial explosion.”
Once you get to 10 elements, there are more recipes than seconds since the big bang created the universe. As you keep going, it becomes obvious that there have been two few people on earth and too little time since we showed up, for us to have tried more than a minuscule fraction of the all the possibilities.
Of course, even this vastly underestimates the possibilities. Different proportions will lead to compounds with different properties and they can be combined under a wide variety of pressures and temperatures. Moreover, instead of just mixing elements together in a disorganized fashion, we can use chemical reactions to combine such elements as hydrogen and carbon into ordered structures like acids and proteins.
To see how far this kind of process can take us, imagine the ideal chemical refinery. It would convert an abundant, renewable resource into a product that humans value. It would be smaller than a car, mobile so that it could search out its own inputs, capable of maintaining the temperature necessary for its reactions within narrow bounds, and able to automatically heal most system failures. It would build replicas of itself for use after it wears out, and it would do all of this with little human supervision. All we would have to do is get it to stay still periodically so that we could hook up some pipes and drain off the final product.
This refinery already exists. It is the milk cow. Nature found this amazing way to arrange hydrogen, carbon, and a few other miscellaneous atoms by meandering along one particular evolutionary path of trial and error (albeit one that took hundreds of millions of years). Someone who had never heard of a cow or a bat probably would not believe that a hunk of atoms can turn grass into milk or navigate by echolocation as it flies around. Imagine all the amazing things that can be made out of atoms that simply have never been tried.
Meta-ideas
If we think of an idea as a recipe that shows how to create value by rearranging physical objects, it makes sense to define a meta-idea as a recipe for social interaction that encourages the production and transmission of ideas. Growth comes from ideas about objects. Meta-ideas are ideas about ideas.
For developing countries, the priority is to find a way to make use of the tested strategies that richer countries have already used to have a higher standard of living. One of the biggest meta-ideas of modern life is to let people live together in dense urban agglomerations. A second is to allow market forces to guide most of the detailed decisions these people make about who they interact with each other. Together, the city and the market let large groups of people cooperate by discovering new ideas, sharing them, and learning from each other. The benefits can show up as a new design for a coffee cup or wages for a worker that grow with experience acquired in jobs with a sequence of employers. People living in a large city cooperate with residents there and through many forms of exchange, with residents in other cities too. Cities connect us all together. China’s growth reflects is rapid embrace of these two big meta-ideas, the market and the city.
The third big meta-idea is the system of science that has turbocharged the pace at which we can now explore the vast number of possibilities that combinatorial explosion offers up. This meta-idea has its roots in the Enlightenment, but it continues to evolve. One important innovation came with the passage of the Morrill Act in the United States in 1862. It invented a new type of university, one that was instructed to focus on “the agricultural and mechanic arts.” (This is why some of these universities still include A&M as part of the name.) This practical focus had important consequences for economic activity. Well into the 20th century, traditional universities in Britain and Germany had stronger basic science in chemistry (and had the Nobel Prizes to prove it.) But new schools of chemical engineering started by two of the Morrill Act universities (Purdue and MIT) helped the United States surge ahead to the worldwide leader of the petrochemical industry.
The institutions of science changed again after WWII, when the United States implemented a new system of federally funded research grants, provided by a variety of federal agencies as support for “mission oriented basic research.” Together with the migration to the US of leading scientists from Europe caused by the war, this new system pushed the United States into a new position of worldwide leadership in science that matched its position as the leading economic power well before WWII.
What have We Done Lately?
We do not know what the next new meta-idea analogous to the new type of university spawned in the 19th century by the Morrill Act or the system of competitive grants and mission oriented basic research that emerged in the 20th century. But it is not too soon to start considering possibilities for comparable innovation in the 21st century.
One feature shared by these last two innovations is that they offered subsidies that increased the supply of newly educated scientists and engineers. Universities produce both papers and people. People with specialized problem-solving skills are the essential input into the discovery process, most of which takes place in the private sector. People with these skills are fuel that fires the innovation engine.
Currently, most of these subsidies are given to universities and professors, who then dole them out to graduate students. One experiment worth trying would be to add a large number of fellowships for graduate education that are awarded directly to promising young undergraduates who are considering further study in science and engineering. If these fellowships were portable, so that the recipient could pursue any course of study at any institution, it would add an interesting new dimension of competition to higher education. It might encourage more innovation, perhaps even the entry of new competitors. After all, it is probably not a sign of health that in the research university business, the United States has not seen a successful new entrant since Stanford and the University of Chicago were founded at the end of the 19th century.
Only a failure of imagination—the same failure that lets people think that all the big ideas have already been discovered—could convince us that with our current institutions of science, we have already found the best of all possible system for encouraging the production and distribution of new ideas. There is surely room for improvement. Improvement might increase the rate of growth by a little bit. The benefits that follow will accumulate faster than people realize.
This is #4 in a collection of posts that mark the 25th anniversary of the publication of my 1990 JPE paper. It borrows from an essay I wrote for the The Concise Encyclopedia of Economics. Extracts used here with permission from the copyright holder, David R. Henderson.
Note Added July 16: I’ve reposted this to fix some problems associated with rendering of tex and “$” characters.