Urbanization Passes the Pritchett Test
The data presented here convinces me that policy-induced changes in the urban share of the population could have big effects on GDP per capita and could operate on a scale that affects the quality of life for billions of people. So in research on development policy, I am not persuaded that economists should narrow their focus to the analysis of such easily evaluated micro-initiatives as funding women’s self-help groups. Neither is Lant Pritchett.
In a characteristically incisive blog post, Lant expresses skepticism about the value of micro-initiatives that are being tried as strategies for encouraging economic development because they are easy to evaluate rather than because experience suggests that they have worked at a scale that is comparable to the problem that policy should address.
He recalls his experience as a member of a team with members from many developed countries that was evaluating a program in India that financed women’s self-help groups. A woman from West Bengal who had answered their questions said to the team, “You all are from countries that are much richer and doing much better than our country so your country’s women’s self-help groups must also be much better, tell us how women’s self-help groups work in your country.” Quoting now from Lant’s account:
We all looked at each other blankly as none of us had any idea whether there even were at any time in our countries’ history such a thing as “women’s self-help groups” … (much less government program for promoting them). We also had no idea how to explain that, yes, all of our countries are now developed but no, all of our countries did this without a major role from women’s self-help groups at any time (or if there were a role we development experts were collectively ignorant of it), but yes, women’s self-help groups promote development.
Pritchett proposes a basic, four part test that economists could consider when someone claims that governments or donors should experiment with policies designed to promote variable X because more X is good for development:
-
In a cross-sectional comparison of levels, do countries that are more developed have more X?
-
In cross-sectional comparison of growth rates, do countries that have rapid growth in X also tend to experience a rapid increase in standards of living?
-
When we look at the few countries for which we have long historical records, do the ones that become much more developed also acquire much more X?
-
If we look for countries that switch from a regime of slow economic development to a regime of rapid development, do we see a parallel shift in the rate of growth of change in X?
Here I’ll show that when we consider the urban share of the population as our candidate variable (with no attempt at correcting for the quality of urbanization), the data from many countries over the years from 1955 to 2010 show that the answer to questions 1, 2, 3, and 4 is yes. More urbanization is robustly associated with higher income per capita.
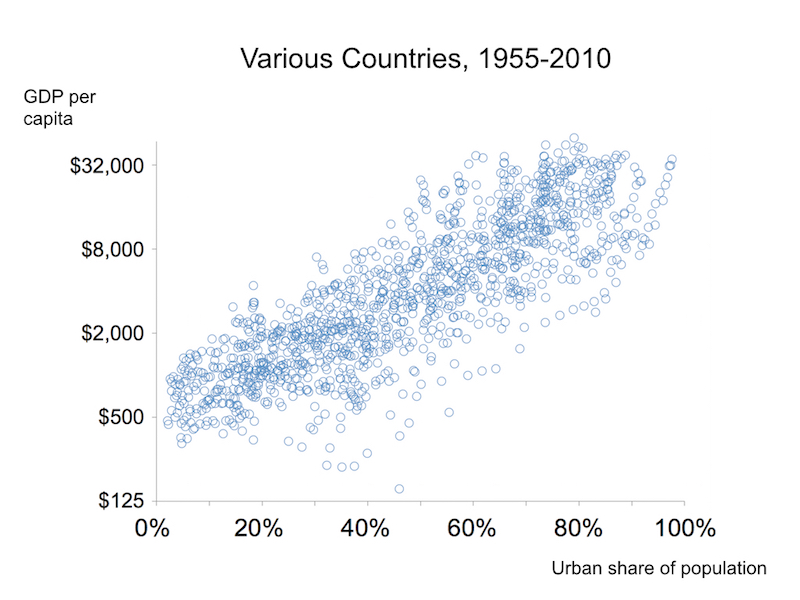
Figure 1
Figure 1 presents the urban share of the population and GDP per capita (measured on a log or ratio scale) every 5 years from 1955 to 2010 for all year-country pairs. The urban share data comes from the United Nations. GDP per capita come from the Penn World Table 8.0. It shows the positive correlation of urbanization with GDP per capita, but it does not split it into the cross-sectional and time-series components that Pritchett encourages us to consider separately.
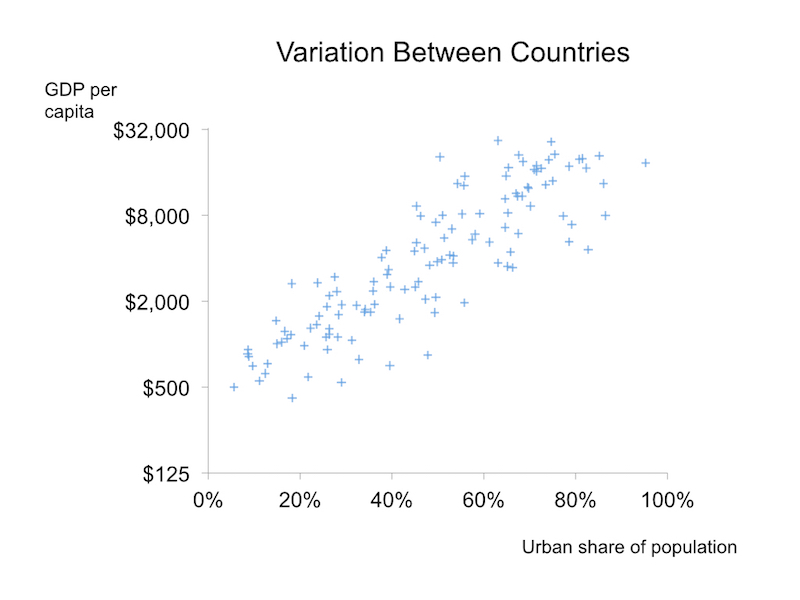
Figure 2
Figure 2 shows the variation between countries. For each country, it plots average GDP per capita and the average urban population share. It shows that the answer to question #1 is yes. In a contemporary cross section, countries that have more income per capita are more urbanized.
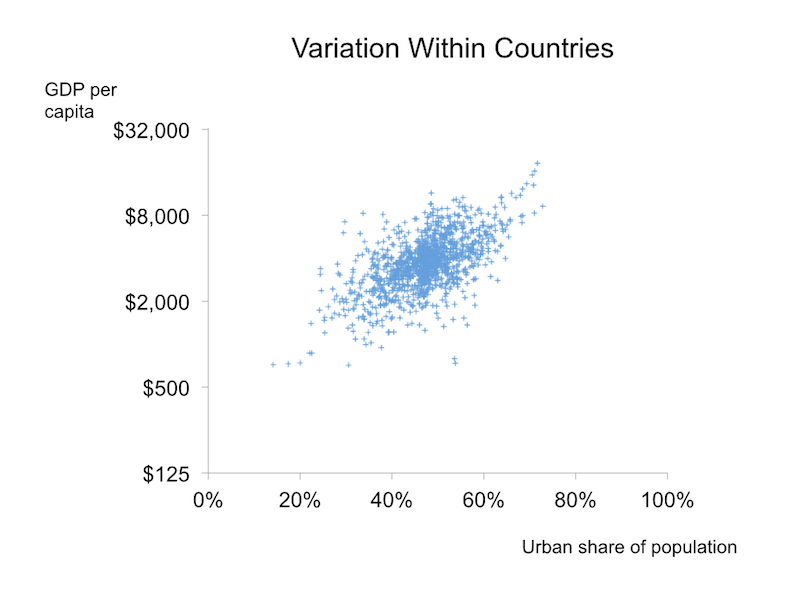
Figure 3
Figure 3 plots the variation within countries. It removes the country averages for the two variables and replaces them with the worldwide averages. The within country variation does not show as much correlation as the between country variation, but nevertheless, it shows that the answer to question #2 is yes, it is still the case that over time, income per capita and the urban population share increase together.
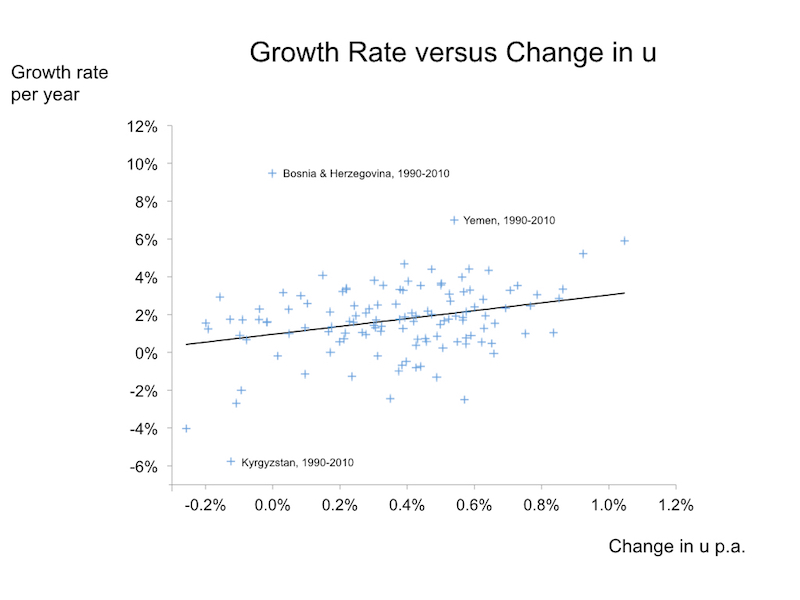
Figure 4
Figure 4 addresses question #2 more directly. For each country, it shows the average growth rate per year and the average change in the urban population share u per year, for the longest time interval available in the data. (The figure also marks three prominent outliers, all of which have data for only 20 years.) It also shows the regression line for these data, which implies that a change in u that is higher by 100 basis points per year is associated with a growth rate of GDP that is about 2% per year higher, with a t-statistic of about 3.
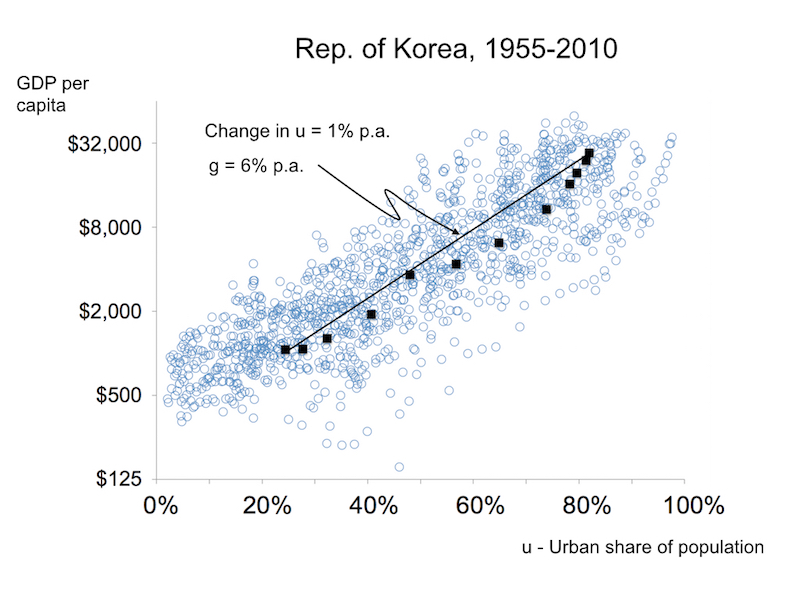
Figure 5
Figure 5 uses South Korea, one of the clear success stories of economic development, as an example of a country that allows a relatively long historical view, long that is within the restrictions imposed by the availability of these data. The figure uses as a background the data from Figure 1, with all observations on all countries for the urban share and GDP per capita. (In each country, data on the urban population share is available only every 5 years, so there are at most 12 points for each country.) This figure also highlights the 12 points for South Korea with black squares and plots a line that connects the initial and final values. The slope of this line shows that each additional 100 basis points added to u is associated with a 6% increase in GDP per capita. It suggests the conclusion that would no doubt emerge from a less quantitative historical analysis of any Western European or European Offshoot countries, that the answer to question #3 is also yes. The long-run historical evidence suggests that the countries are now the most developed also became much more urbanized.
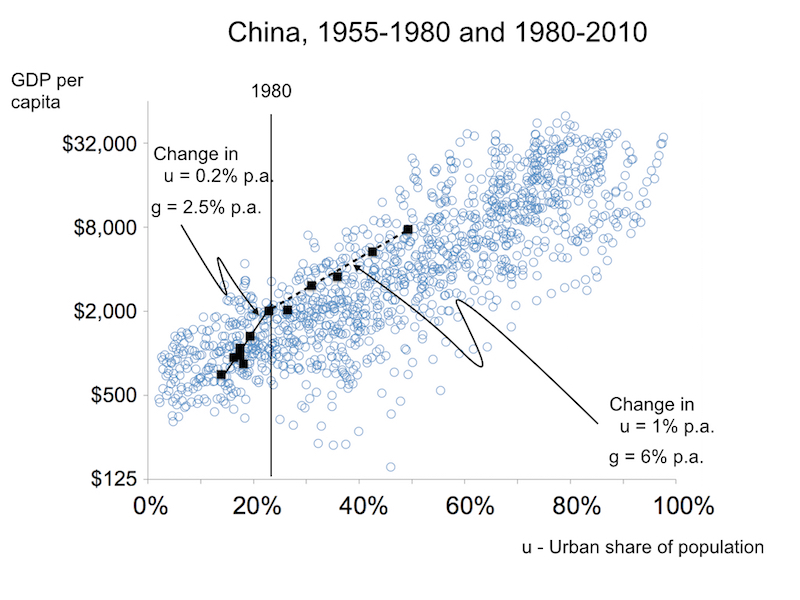
Figure 6
Figure 6 does the same exercise for China as for South Korea, but it breaks the experience there into two periods, before and after 1980. Before, the urban share increases at the rate of 20 basis points per year percentage points per year and growth in GDP per capita is about 2.5% per year. After, it increases by 100 basis points per year and growth averages about 6% per year. The Chinese experience offers evidence that the answer to question #4 is also yes. It is a country with a sharp break that is followed by increases in the rate of increase of both u and GDP per capita. Note that the location of the dots in the second interval, toward the northwest edge of the cloud and northwest of the corresponding line for South Korea, suggests that for its level of income, China is if anything somewhat under urbanized.
There is much that economists and policy makers need to learn about the causal connections between GDP growth and growth in the urban share. It is also very important to understand which other policies complement faster urbanization. Because urbanization passes the Pritchett test, it deserves intensive practical analysis and careful but ambitious exploration and experimentation.
Humans already do things that overwhelm the imagination. For example, they manage to get food each day to the more than 3 billion people who already live in cities. The evidence here on the potential benefits from faster urbanization hint at the possibility if the right policies expanded those amazing things to a scale of urban activity that is 2 to 3 times bigger than it is now, the quality of life could substantially improve for billions of people. These policies could give everyone on earth the chance to contribute to and benefit from the interactions that current urban residents already enjoy. The magnitude of what is at stake should not be used as an excuse for more hesitation and delay. It should impel us forward.
* In Sept. 2015, I updated this post to simplify the exposition and improve the readability of the graphics. I posted the original version in May 2015.