Infrequent Events and Proxy Indicators
A recent study of vaccine effectiveness using data from the Mayo Clinic shows why it is sometimes better to base policy decisions on a change in a proxy indicator rather than to wait until effects are visible as a change in a direct measure of the variable we care about.
In deciding whether to offer third doses of the vaccines, the indicator we care about the most is a vaccine’s effectiveness in preventing severe disease. Nevertheless, many people have focused on changes in effectiveness against infection because researchers can measure it more accurately.
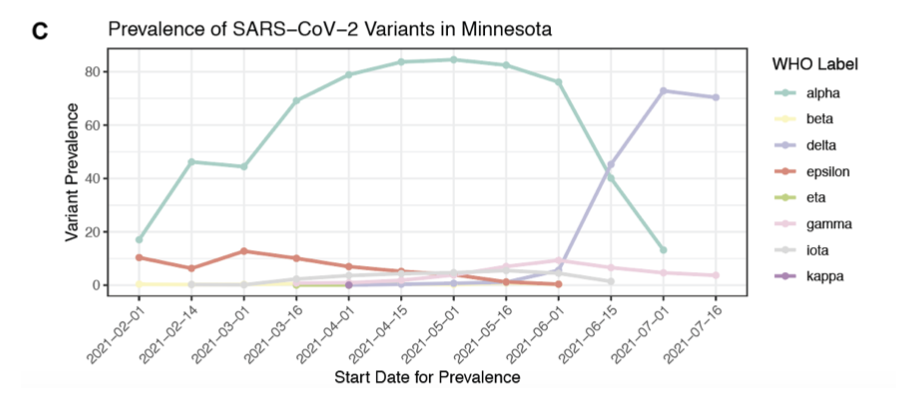
As these two figures from the paper show, the authors found statistically significant evidence that this proxy indicator of vaccine effectiveness fell as delta took over in Minnesota:
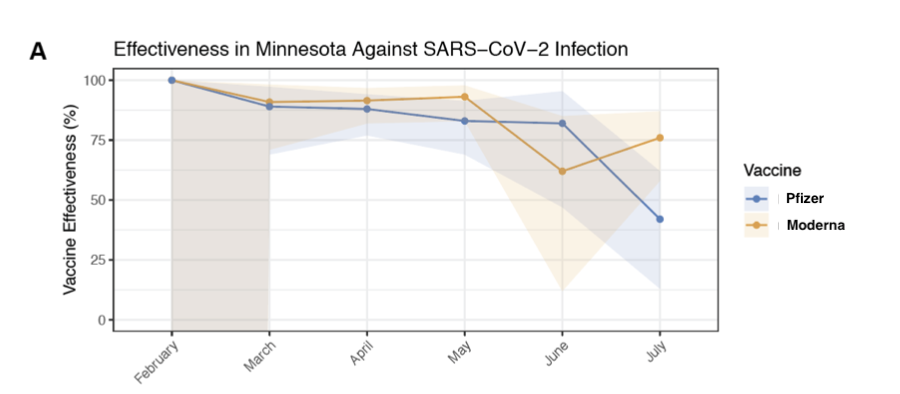
The shaded area shows the ||95\%|| confidence interval for effectiveness of each vaccine against infection during for each month.
The study did not find statistically significant evidence of a fall in effectiveness of the vaccine in preventing hospitalization, which can be taken as an indication of severe disease. Is this reassuring?
Absolutely not. By the logic outlined in a previous post in this blog, if more people get infected, we should expect a proportional increase in the number of people who experience severe disease.
So why didn’t this study find the implied increase in the number of hospitalizations? Because the numbers in this study are so small that any change gets lost in the noise.
Look at the very small number of hospitalizations in the group of Pfizer vaccinated individuals that the researchers followed:
| Counts in Pfizer and Not Vaccinated Groups | |||||||
|---|---|---|---|---|---|---|---|
| Feb | Mar | Apr | May | June | July | ||
| Hospitalizations | Pfizer | 0 | 1 | 2 | 3 | 1 | 4 |
| Not Vaccinated | 0 | 9 | 20 | 25 | 7 | 18 | |
| Infections | Pfizer | 0 | 4 | 11 | 13 | 4 | 38 |
| Not Vaccinated | 1 | 37 | 93 | 82 | 24 | 73 | |
In May, June, and July, there were about 20,000 people in both the Pfizer group and the not-vaccinated group. This is enough to see hospitalizations in the double digits in the not-vaccinated group and as a result, to see a difference compared to the Pfizer group. But the single digit numbers in the Pfizer group are way too small to be able to pick up any increase during June and July.
For the more numerous infections, which are in double digits even in the Pfizer group, it is clear that there is a substantial increase in July, the first month when delta was the dominant variant.
One can always wish for more data, but in practice, it is very difficult to get a sample that is large enough to pick up changes in the relative risk of such infrequent but costly events as hospitalization. Here is the type of problem that researchers have to confront. The Mayo Clinic has patients in other states, but to test for a fall in the effectiveness of the vaccines, the study had to restrict attention to patients in Minnesota because it was only for patients there that the clinic had reliable administrative information about vaccine status.
Of course, the other way to get more data is to take no action and let time pass, but in the current context, there is no excuse for hesitation and delay. The logic is clear. An increase in the relative risk of infection should be expected to induce a proportional increase in the relative risk of hospitalization. So is the evidence. From this study and several others like it, we already have statistically significant evidence that the effectiveness of the vaccine against infection fell as delta became the dominant variant.
The point of having a canary in the coal mine is that you take action when the canary dies without waiting for enough miners to die to have statistically significant evidence that their lives are in jeopardy.