Urbanization versus GDP per Capita
In a recent article on urbanization in China The New York Times presented this graph of the urban population share versus GDP per capita in a selected set of countries:
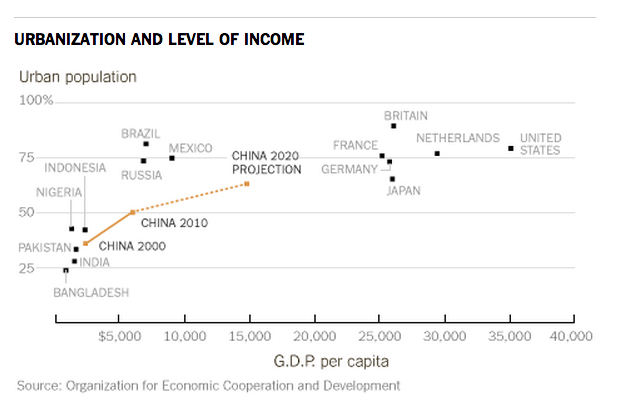
The NYTimes article seemed to suggest that China is trying to achieve an urban population share that is inappropriately high.
If the idea was to suggest, for example, that China is trying to achieve the same urbanization rate as Japan but at a much lower level of income, it matters if the data point for Japan is in the right place. It looked wrong because contrary to what the graph shows, other sources report that Japan is more urbanized than Germany. It is also hard to tell what unit the published graph used to measure income. The article attributes the graph to the OECD but does not mention the underlying data source.
The graphs below use data from the UN on the urban population share and GDP per capita from the Penn World Tables (v7.1). I include South Korea because it is a useful case for comparison. The point for China in 2025 reflects the UN projection for China’s urban share in that year and the assumption from the NYTimes article that GDP per capita will double in China between 2010 and 2025. (The discussion in the text of the NYTimes article made it seem that the point in question would be for China in 2025, not 2020, so I used projections for that year and changed the label.)
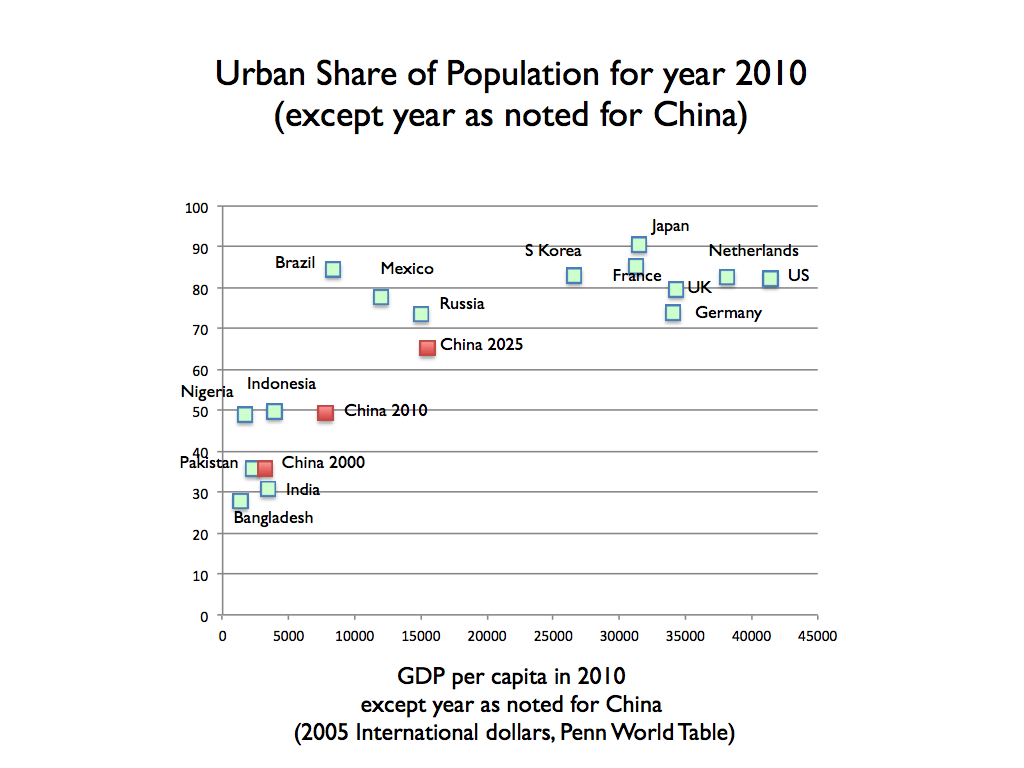
For comparison, see the graph below, which has data for the other countries from the year 2010.
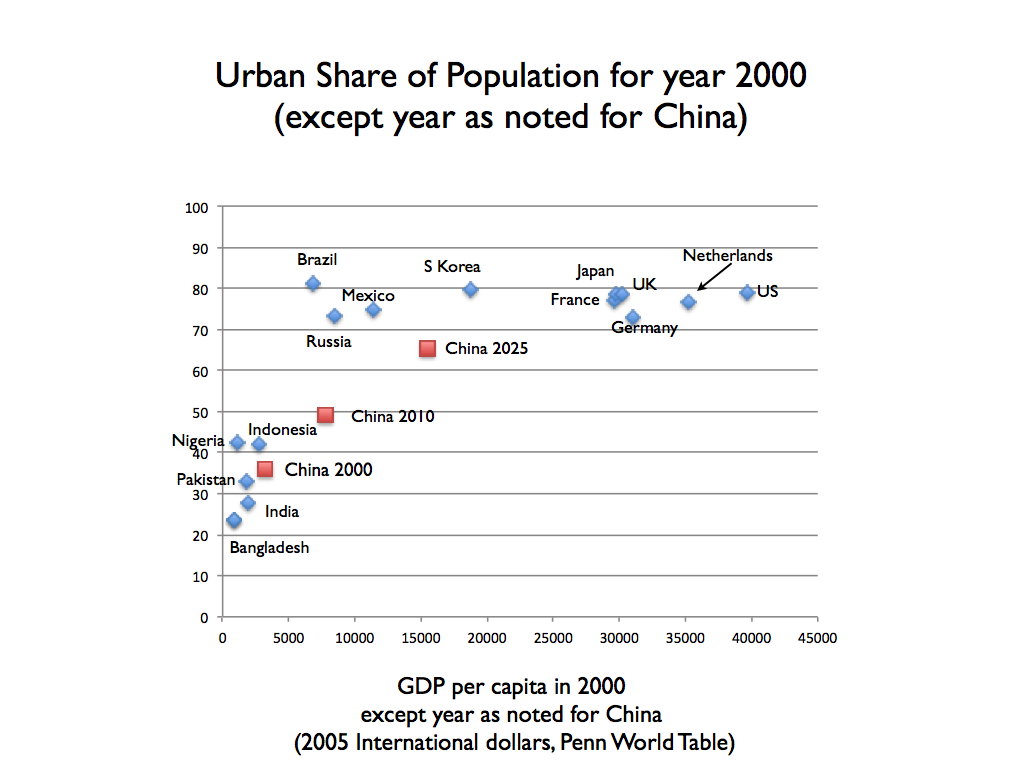
These graphs convey a different impression of how the projections for income and urbanization in China compare to the experience in other countries. It is also useful to note that in the comparison of the graphs for 2000 and 2010, the urban population share continues to increase in richest countries of the world. As China considers an increase in its urban share out to 2025, it might be reasonable to consider not just a target represented by where the richest countries were in 2000, but also where they will end up as their urban share continues to increase.
With these new graphs in hand, it is revealing to return to the interpretation offered in the article:
“Skeptics say the government’s headlong rush to urbanize is driven by a vision of modernity that has failed elsewhere. In Brazil and Mexico, urbanization was also seen as a way to bolster economic growth. But among the results were the expansion of slums and of a stubborn unemployed underclass, according to experts."
China does not have slums. It does not have a stubborn unemployed underclass. Students from its schools score well on international tests, as do the students in S. Korea. It is therefore hard to understand why Brazil is a better guide than a country like S. Korea when it comes to how things will turn out in China.
China’s income is growing rapidly. In the context of the new graphs, it makes sense that the urban share of the population is growing rapidly as well.
That said, the rate of increase in China’s urban population share is slower than the rate experienced in S Korea, so hardly unprecedented or cause for alarm. The number of new urban residents implied by this increase in the urban population share is big, but every number involving people in China is big.
This post originally appeared on the NYU Stern Urbanization Project’s blog. To read the original post, click here.