Bad News About Inflation
You may have seen this headline about today’s inflation numbers, or something like it:
Unfortunately, it gets things backwards. The real news from today’s numbers is that the rate of inflation has increased. From February to March, the CPI index that excludes food and energy shows that prices rose at an annual rate of 5.8% this year but at the lower rate of 5.2% between the same months last year.
As I explained here and here, between Oct 2022 and Feb 2023, this type of comparison of a recent rate with a year-before rate showed that the most recent rate was lower. It was a lot lower for October–December, but it has been coming back up this year, so much so that the comparison now goes the other way. The most recent rate of increase is bigger than the increase one year ago.
The trend is clearly evident in this graph, which updates the one I used last month to facilitate year-before comparisons for each of the last 12 months:
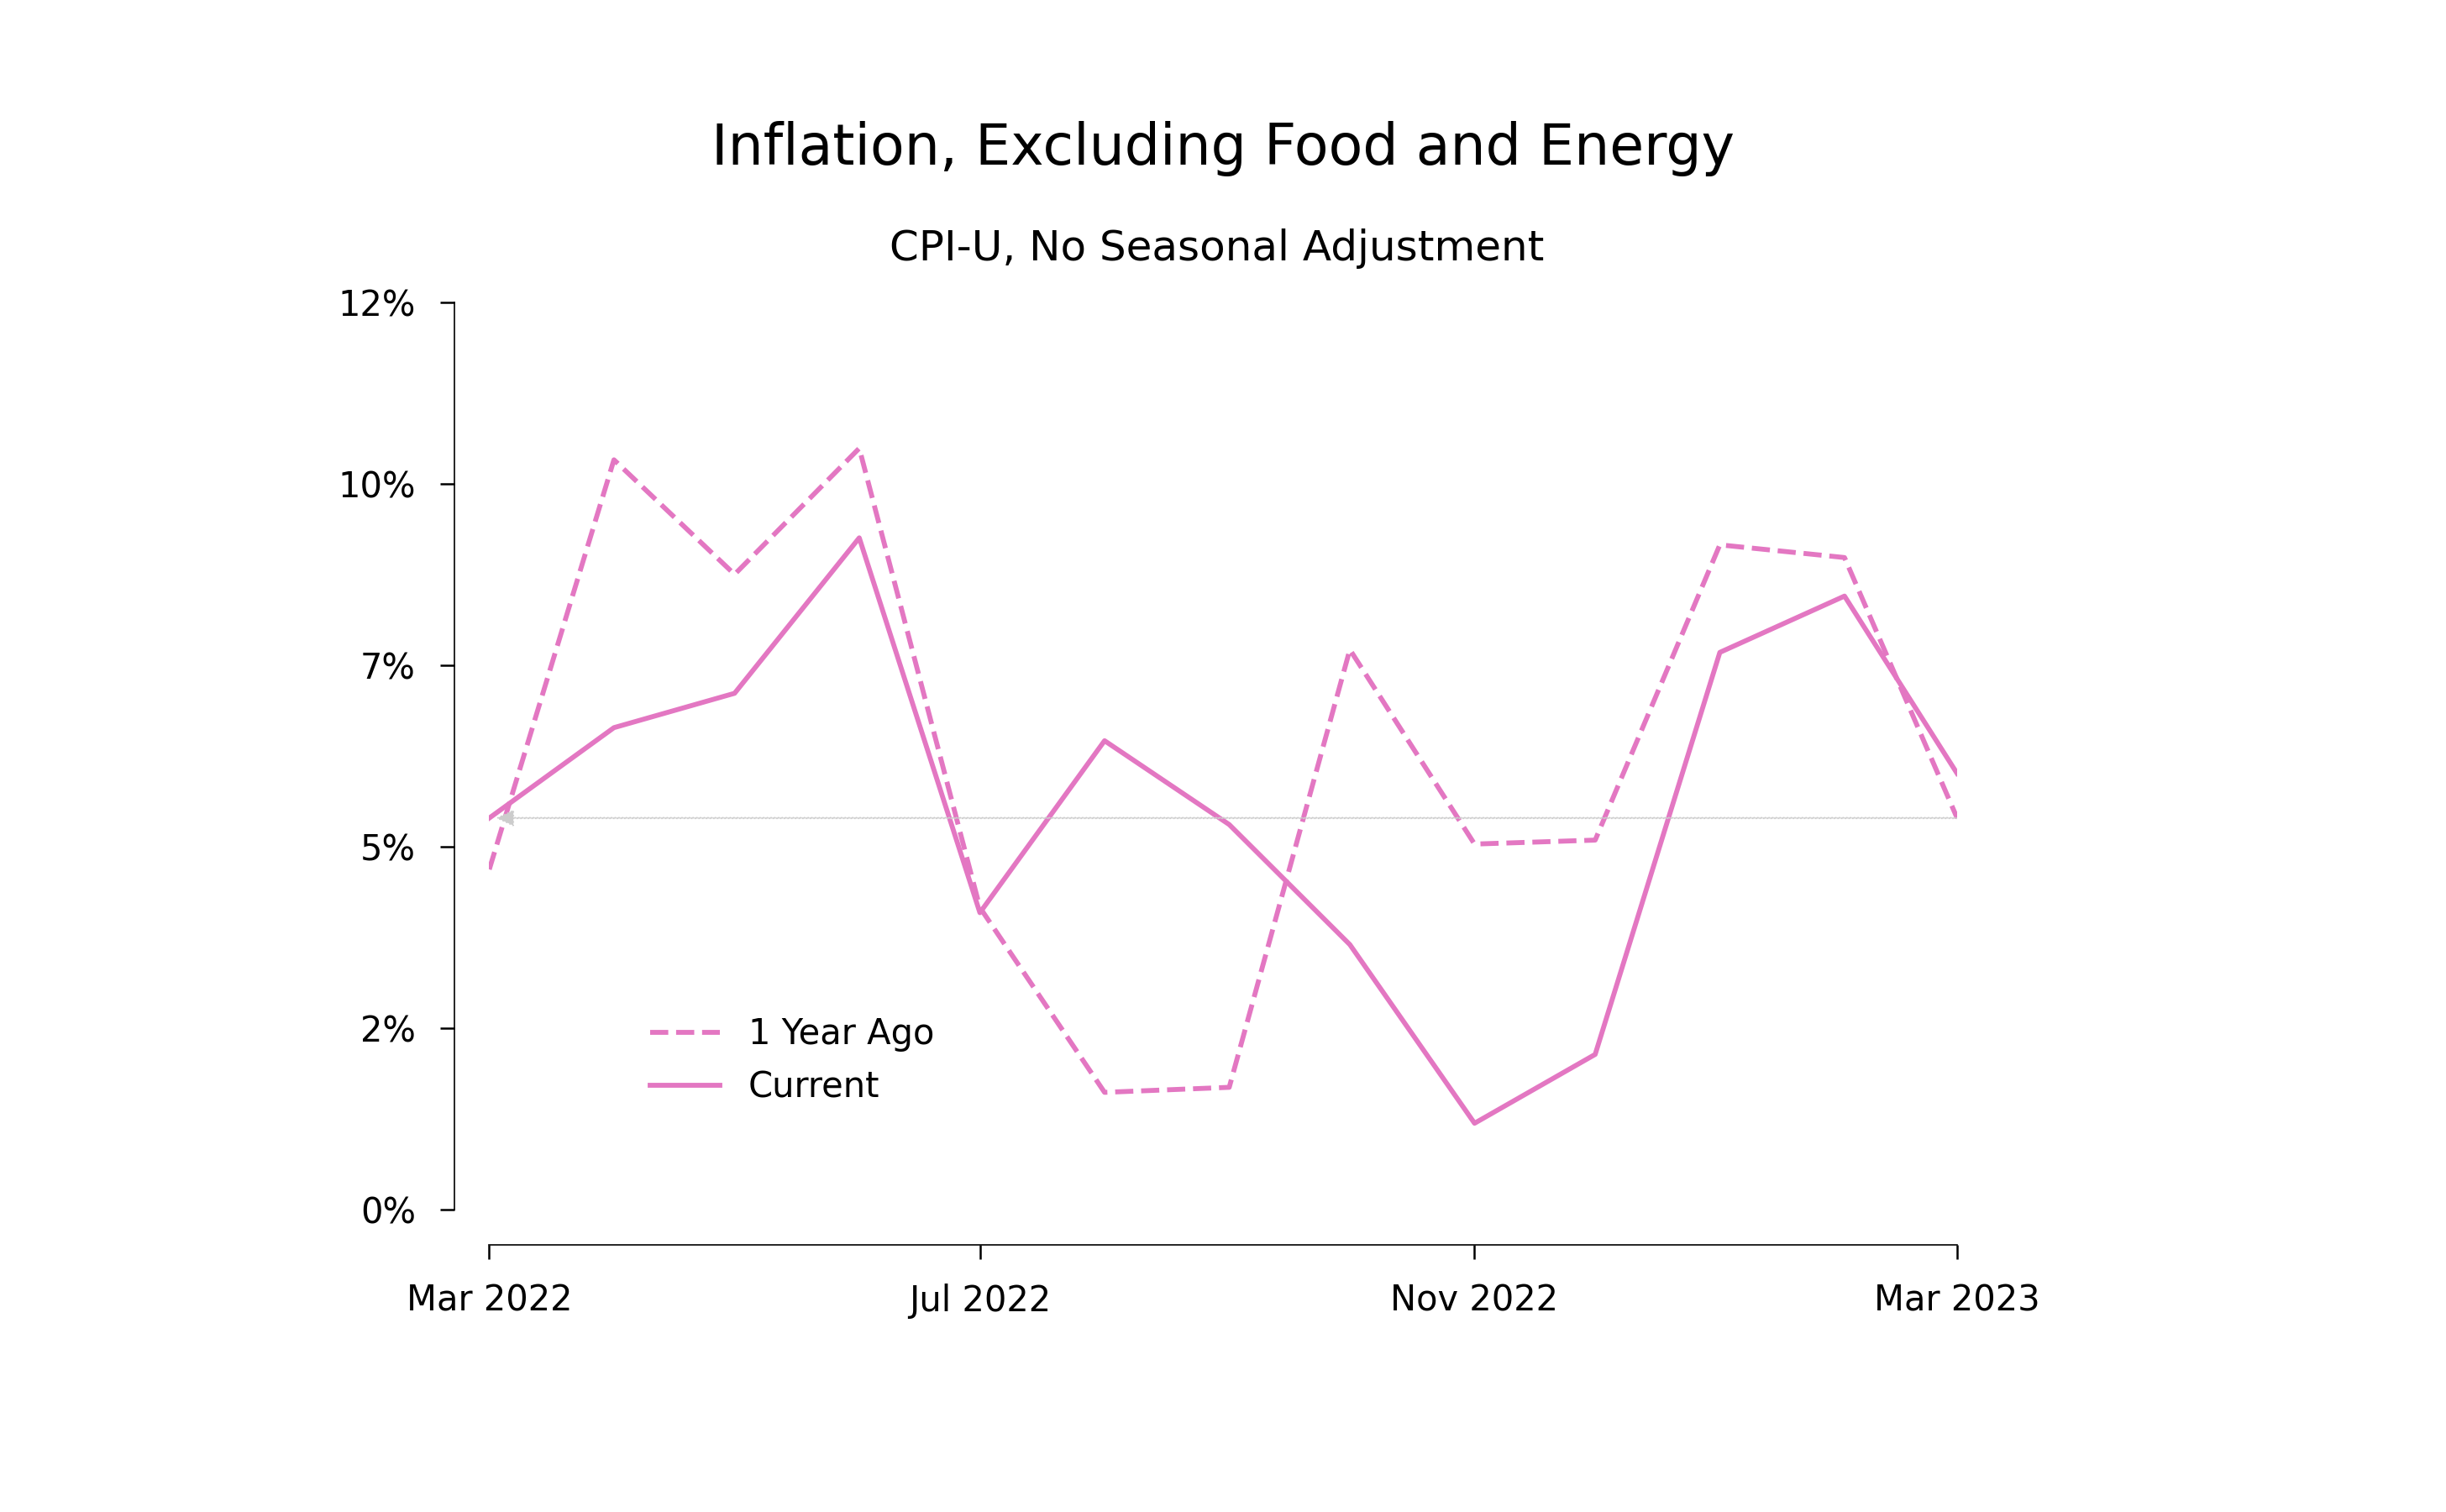
For October–February, the solid line, which shows the most recent rate of inflation, lies below the dashed line, which shows the year-before rate. The gap was large at the end of 2022, but decreased in January and February. Now the two lines have crossed.
The graph reinforces two points that I made before:
-
There seems to be a seasonal pattern in the monthly rate of price increases.
-
It is hard to estimate these seasonal effects precisely.
The big recent change in the seasonal adjustment factors that the BLS started applying in January is a reflection of our imprecise understanding.
Because we are not sure about the seasonal patterns, it makes sense to use a 12-month average to calculate the inflation rate because the seasonal adjustments are constructed in such a way that they average out over any 12-month interval. The most straightforward way to use one 12-month rate is to compare it with a previous 12-month rate. Using the BLS approach to calculating a one-year inflation rate, the rate for the CPI (minus food and energy) was 5.6% for April 2022 to March 2023, about 90 basis points below the rate of 6.5% for the previous 12 months, April 2021 to March 2022.
The problem is that comparisons over 12-month intervals mask what happens over the course of the year. If the month-to-month changes in the rate of change of prices were just noise, it would make sense to mask them. But the patterns evident in the graph do not look like noise. For some reason, for the CPI minus food and energy, it seems that the rate of increase of prices dropped sharply in the last quarter of 2022 but has been recovering back to its previous level since then.
I’m not a one-handed inflation hawk. The gains in wages and employment that the hot labor market is delivering seem very large compared to the modest cost imposed by a temporary period of inflation. But the costs of inflation are higher when inflation is higher, and the trend in the data suggests that the rate of inflation in coming months will be higher than I expected 3 months ago.
I’ve been forcing myself to make a subjective point estimate of the change in inflation relative to first 9 months of 2022 along with an uncertainty interval. Last month I said a reduction by 250 basis points with an uncertainty interval of (-200, 350). A reduction this large would bring us down from 6.5% to 4.0%, a level I was comfortable with. The consistency of the reduction in the gap between the two lines in the graph leaves has reduced my estimate of the reduction in inflation. My revised estimate is a reduction by 100 basis points with an uncertainty interval of (-200, 200). This means an expected inflation rate of about 5.5%, which is too high.
Reasonable people can argue about how quickly to bring the inflation rate down from this level, but I don’t know anyone who would argue that we should stay there.