Inflation Is Still Down ... But By Less
One week ago, I wrote that my point estimate of the decrease in inflation during the last quarter of 2022 was 300 basis points, with a subjective uncertainty interval of (-100, 400).
The data for February offer less support for a large decrease in the inflation rate. My updated point estimate is a decrease in the inflation rate of 250 basis points, with an uncertainty interval of (-200, 350).
The odds that inflation fell still seem to be higher than the odds that it increased, but the difference is not as big as it seemed before.
Year to Year Comparisons
As I wrote one week ago, uncertainty about seasonality in the CPI means that the safe approach was to use the seasonally unadjusted data and compare the change in a recent month with the change in the same month one year earlier.
Here is an updated estimate of this type that includes the just released data for February. In 2021–2, the average rate of increase for prices during the months of October, November, December, January, and February, was 6.9%. In the most recent, same 5 months, the average rate of increase was 4.4%—down by 250 basis points.
The comparison I gave a week ago, before we had the observation for February, showed inflation down by 300 basis points in a comparison of price changes over the most recent months October, November, December, January versus the same months one year earlier. The average rate of increase for the months of October, November, December and January, was 6.5% in 2021–2 and 3.5% in 2022–3.
So there is still some indication that the inflation rate is lower, but the evidence for a decrease in the inflation rate is not as strong as it was before the February data came in. As a matter of simple arithmetic, it has to be the case that a comparison of just the most recent two months shows a smaller decrease in the inflation rate. Indeed, for January and February 2022, the annualized inflation rate was 8.7% and for the same two months this year, the rate was 7.7%—down by 100 basis points.
An inflation rate of 7.7% over the last two months sounds high, but uncertainty about seasonality means that we don’t know how to turn them into a prediction of inflation over any 12-month interval. Prices seem to increase at a faster rate during January and February.
Seasonality
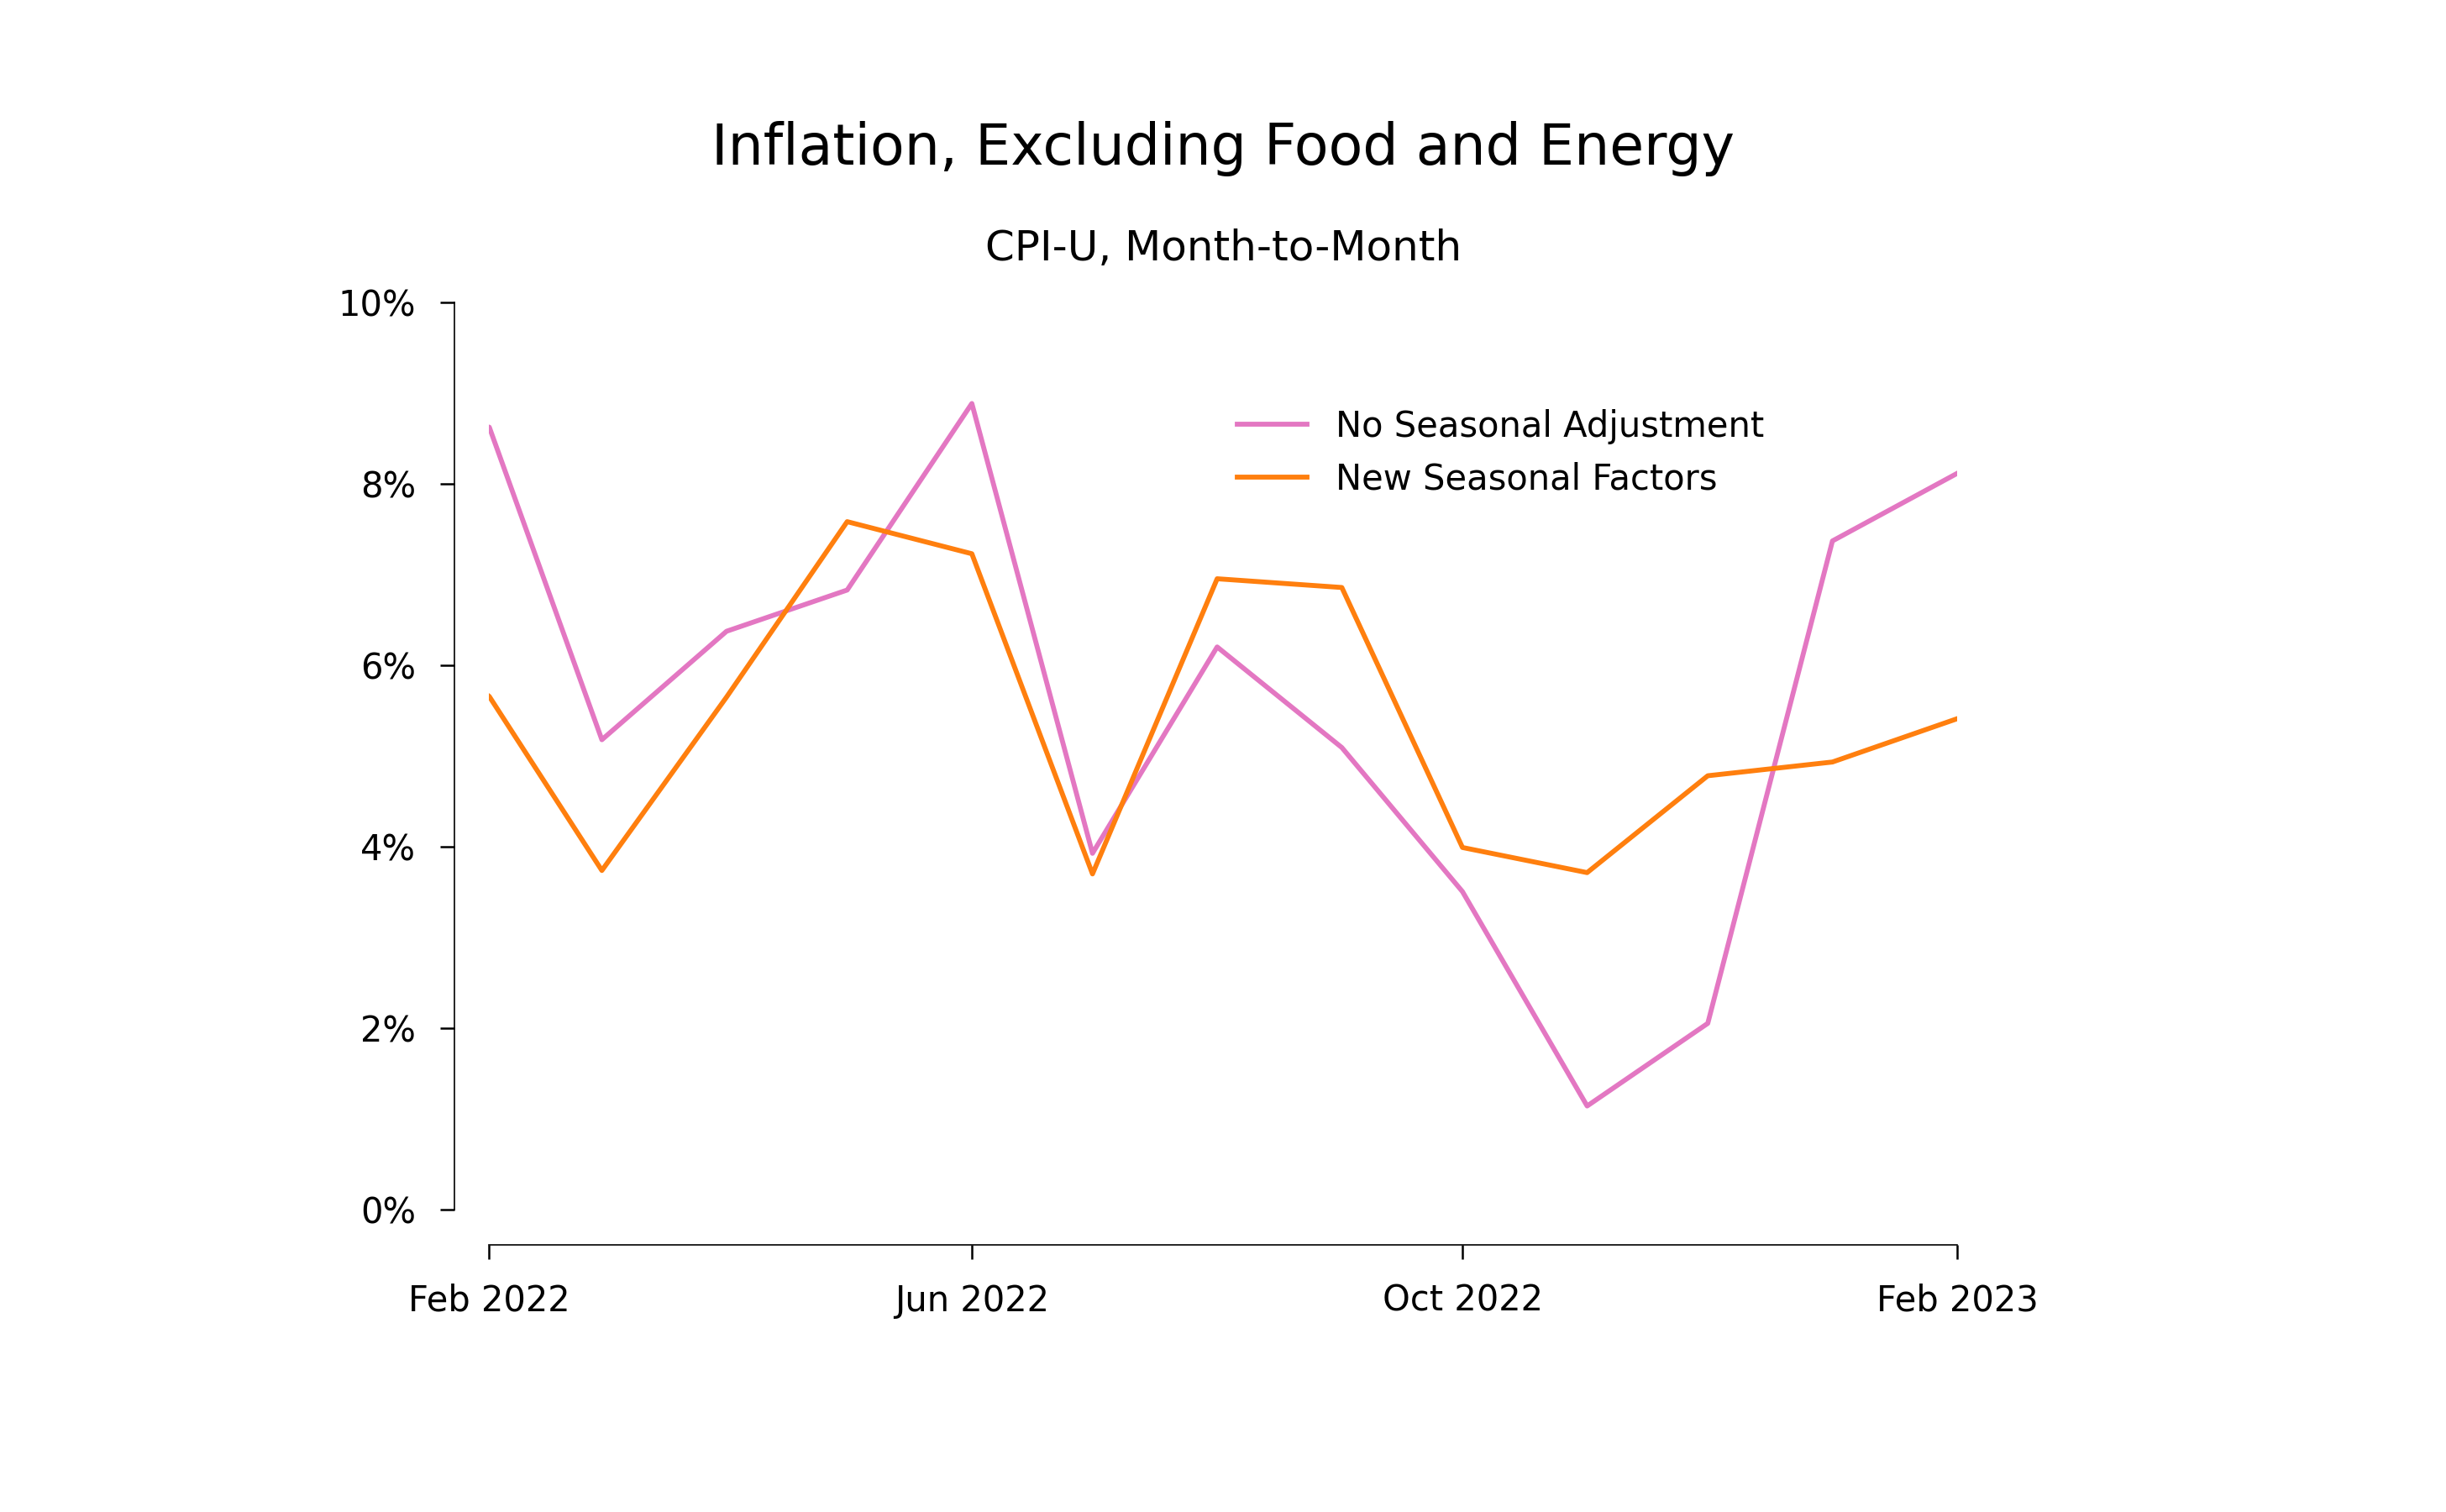
This first graph shows the annualized rate of change of prices from unadjusted data and from the seasonally adjusted data using the new BLS estimates of seasonality. You can tell that the BLS estimates imply that there is a seasonal tendency for prices to go up faster in January and February because in those months, the seasonally adjusted series is so much lower than the unadjusted series.
The next graph facilitates comparisons of the rate of change of prices in recent months relative to the change in the same month, one year ago. Because the horizontal axis goes from February to February, the two series wrap around in the sense that the last data point for 2021–2 is also the first data point for 2022–3. If you look closely, you’ll see a light gray arrow is a visual indication of how this single data series wraps around the graph.
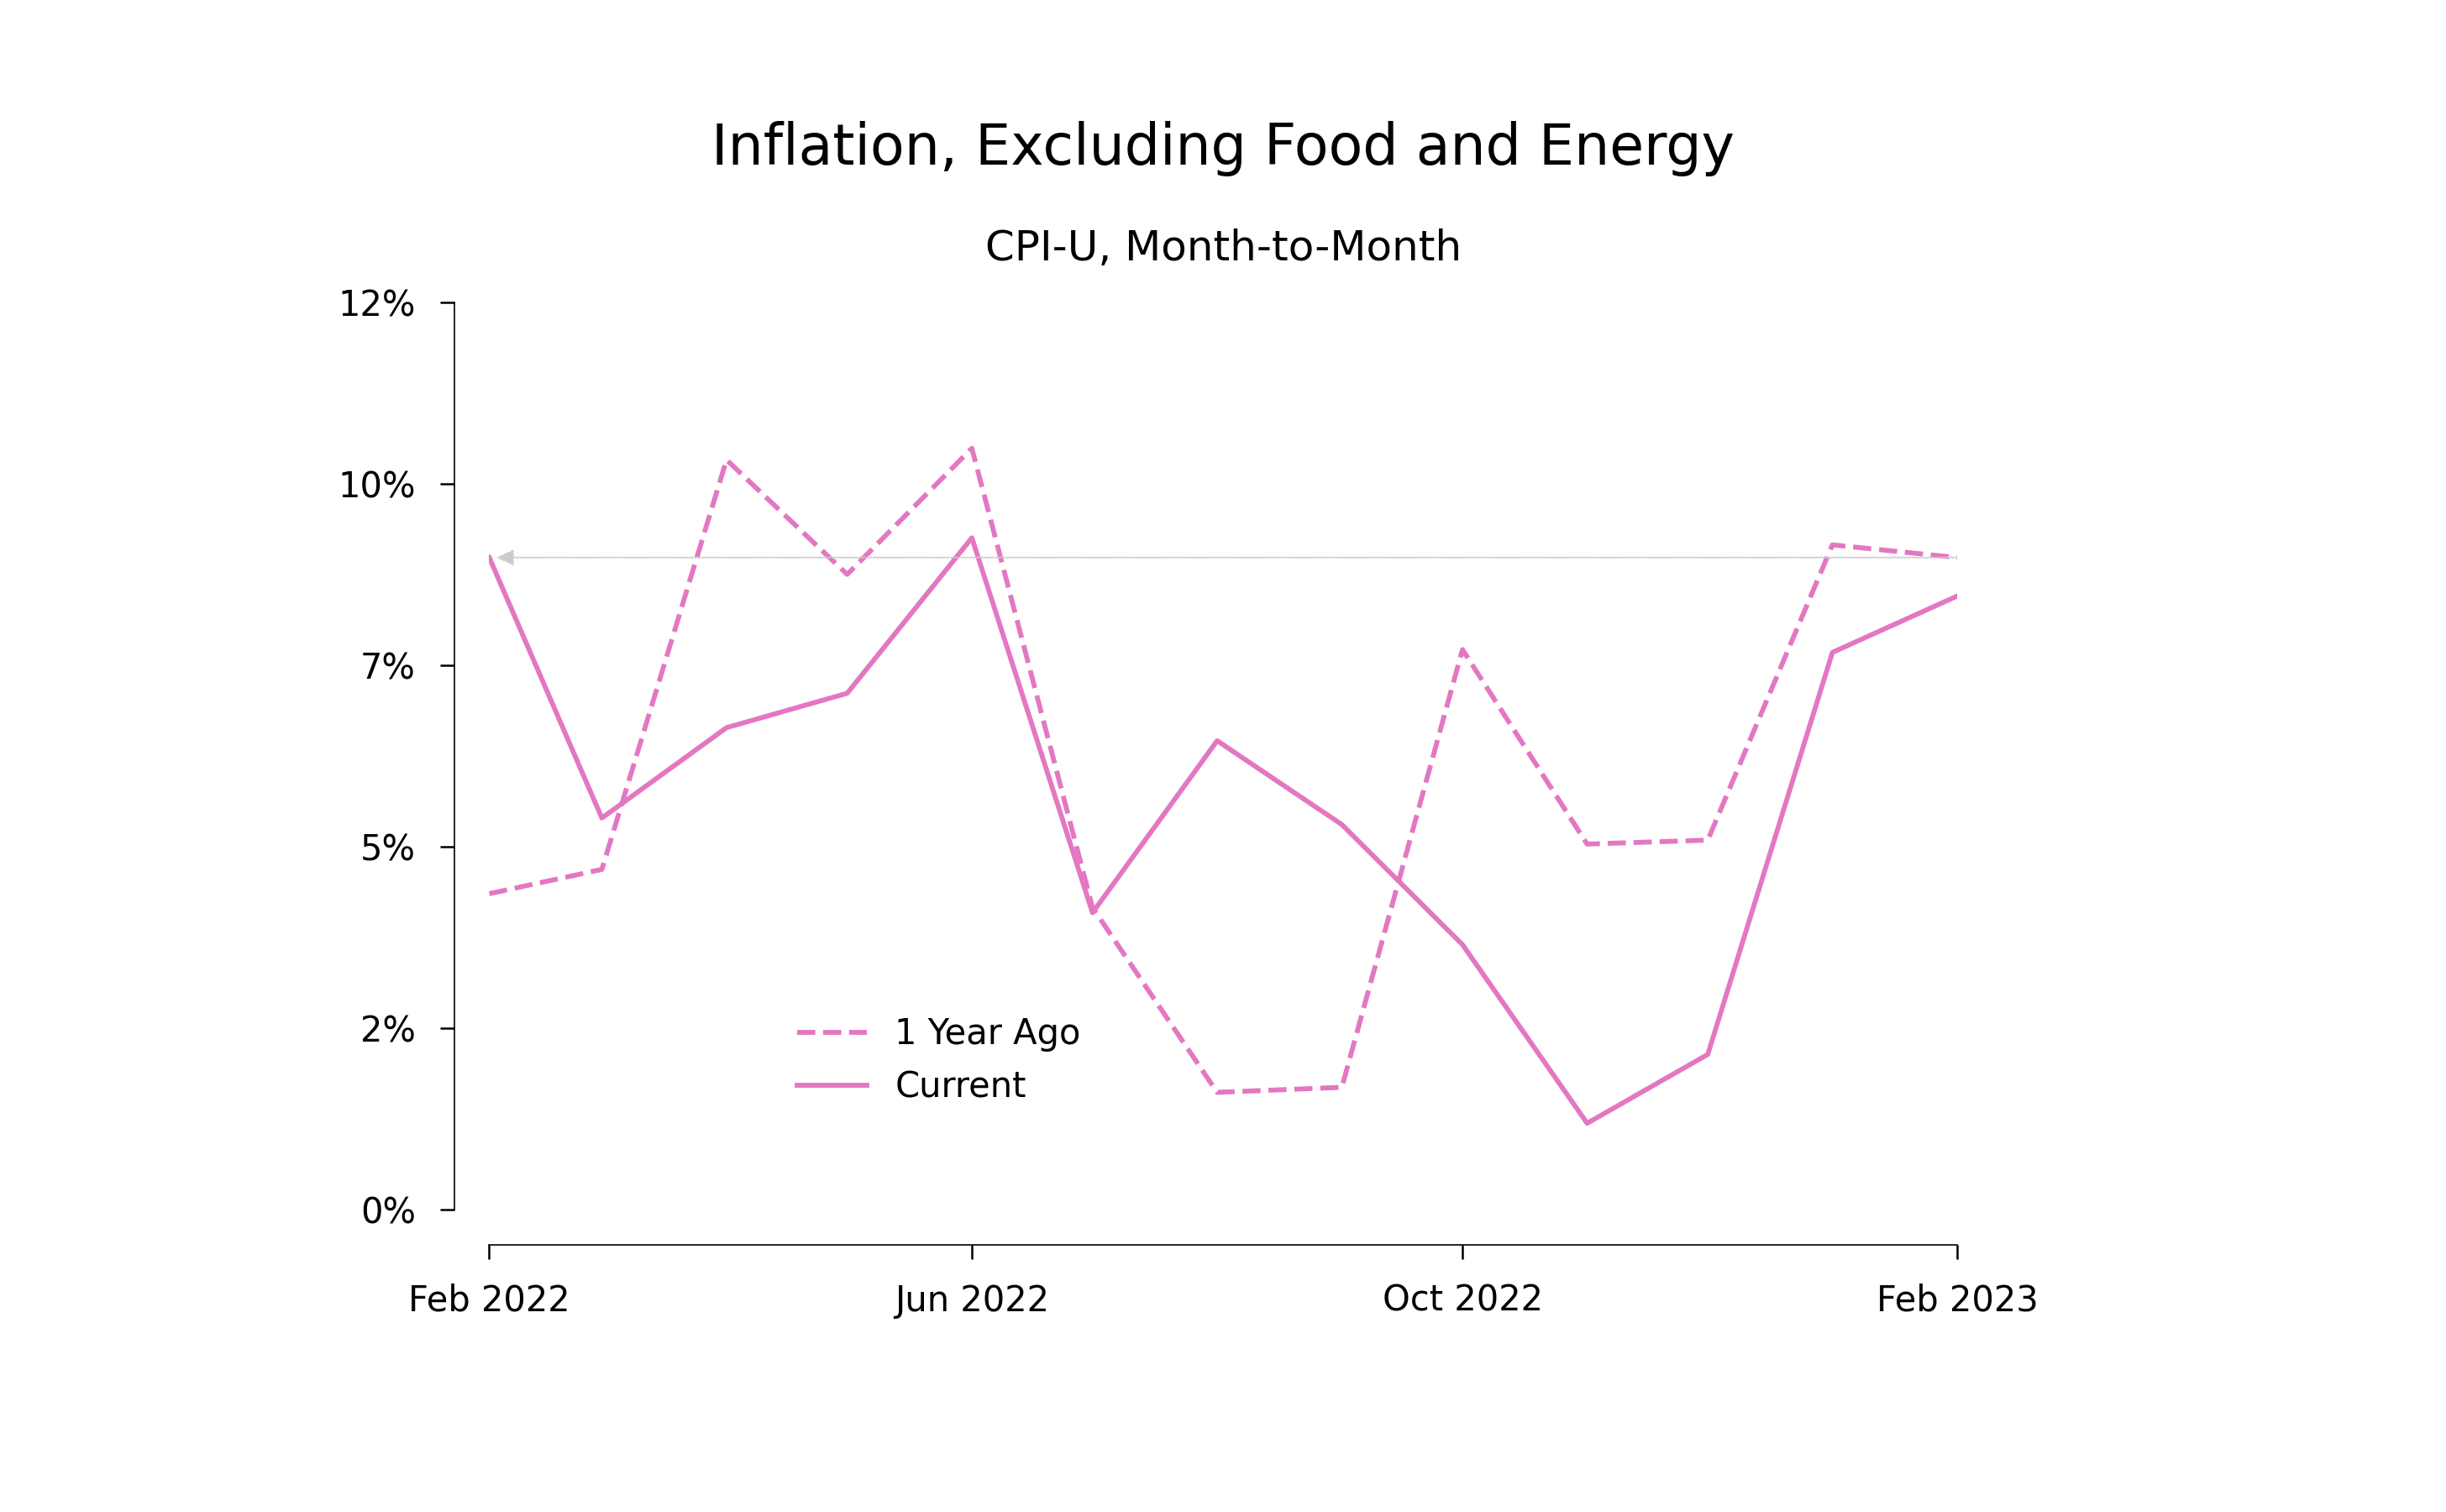
After October, the solid line, which shows the most recent 12 months, lies below the dashed line, which shows data from the previous 12 months. However, the gap is smaller for January and February than it was in the last quarter of 2022. As detailed above, a comparison based on only January and February suggests a reduction of the inflation rate by only 100 basis points. The average gap over all five of the months October-February yields a reduction of 250 basis points. My point estimate of a reduction of 250 basis points gives the same weight to changes in all five months. If someone put more weight on the most recent two months, their estimate of the gap would be smaller.
The final figure adds data for February 2020 to February 2021. Notice that the vertical scale has to get bigger to accommodate these data. Note also that there are now two light gray arrows because the data wrap twice.
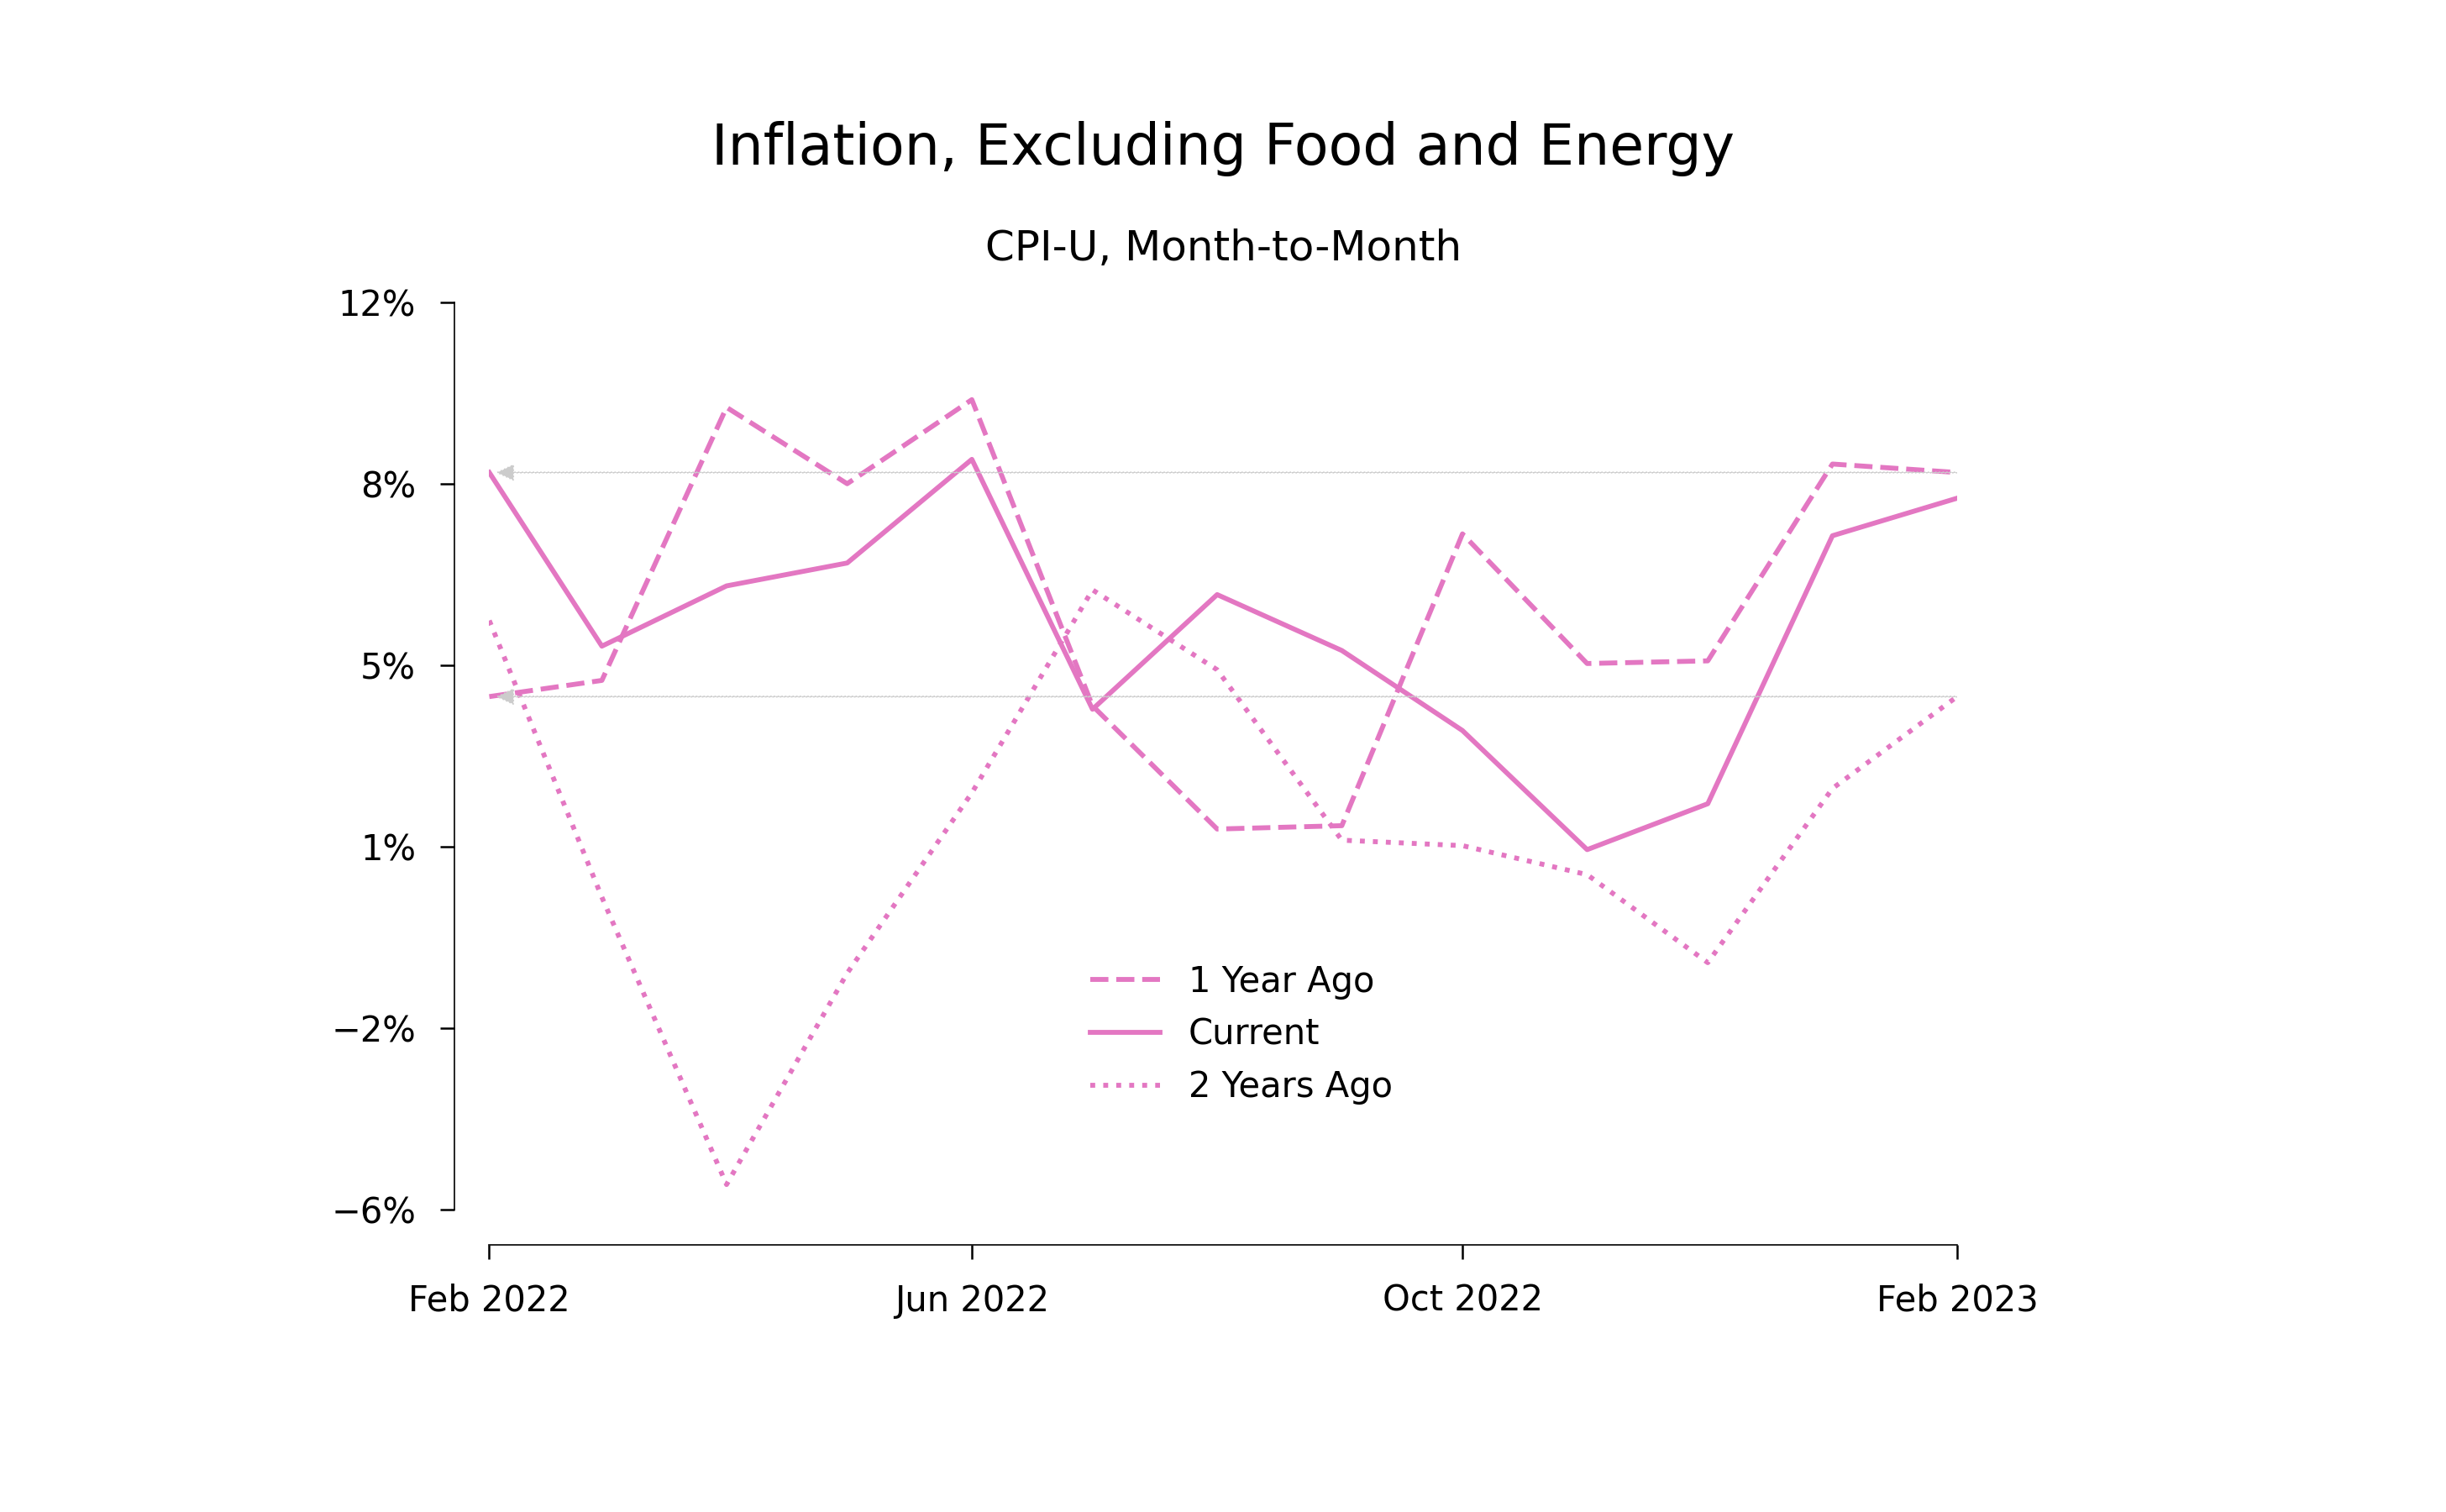
It is hard to know how to interpret the fact the rate of increase in January and February 2021 is higher than the rate in the previous months. This could be a sign of a seasonal effect that causes bigger increases in January and February. But it could also be an early indication of the inflation shock that is clearly visible in the data for April, May, and June of 2021, which are the points on the dashed line that are close to or greater than 8%.
Notes:
1. Unadjusted Data
The BLS ID for the inflation index that I’m using for the unadjusted monthly value of the CPI-U index less food and energy is
Series Id:    CUUR0000SA0L1E

Not Seasonally Adjusted
Series Title: All items less food and energy in U.S. city average, all urban consumers, not seasonally adjusted
Area:         U.S. city average
Item:         All items less food and energy
Base Period:  1982-84=100
For the calculations reported here, I used a file downloaded on Mar. 14, 2023.
2. Seasonally adjusted data
My seasonally adjusted series is
Series Id:    CUSR0000SA0L1E

Seasonally Adjusted
Series Title: All items less food and energy in U.S. city average, all urban consumers, seasonally adjusted
Area:         U.S. city average
Item:         All items less food and energy
Base Period:  1982-84=100
For these seasonally adjusted data, I used a file downloaded on Mar 14, 2023.
3. Annualized inflation rates
For any price index P, the annualized rate of inflation ||\pi_t|| for month ||t|| is ||12|| times the difference between the log of the index in that month and the log of the index in the previous month:
$$\pi_t = 12* (ln(P_t) - ln(P_{t-1}))$$
The annualized rate of change of prices over the three months October, November, and December is the arithmetic average of the 3 monthly annualized rates. The calculation for the four months October–January is the arithmetic average of the 4 monthly annualized rates. The average for October–February is an arithmetic average of the 5 monthly annualized rates.