Seasonality Matters for Inflation
I made a point in an interview today on Bloomberg that is worth emphasizing.
“Inflation was lower in 11 of the last 12 months.”
It is also worth explaining.
Which Index?
First, what inflation measure am I using? If you have been following my posts over the last 12 months on inflation (see e.g. here, or here, or here,) you know that I concluded that it is best to use just one index consistently to make sense of changes in the inflation rate over time. I now use only CPI-U Less Food and Energy.
Which Version?
Second, for reasons that I’ve explained before and will emphasize once again, I use the raw or unadjusted version of this index and apply my own correction for seasonality.
The Most Recent Data
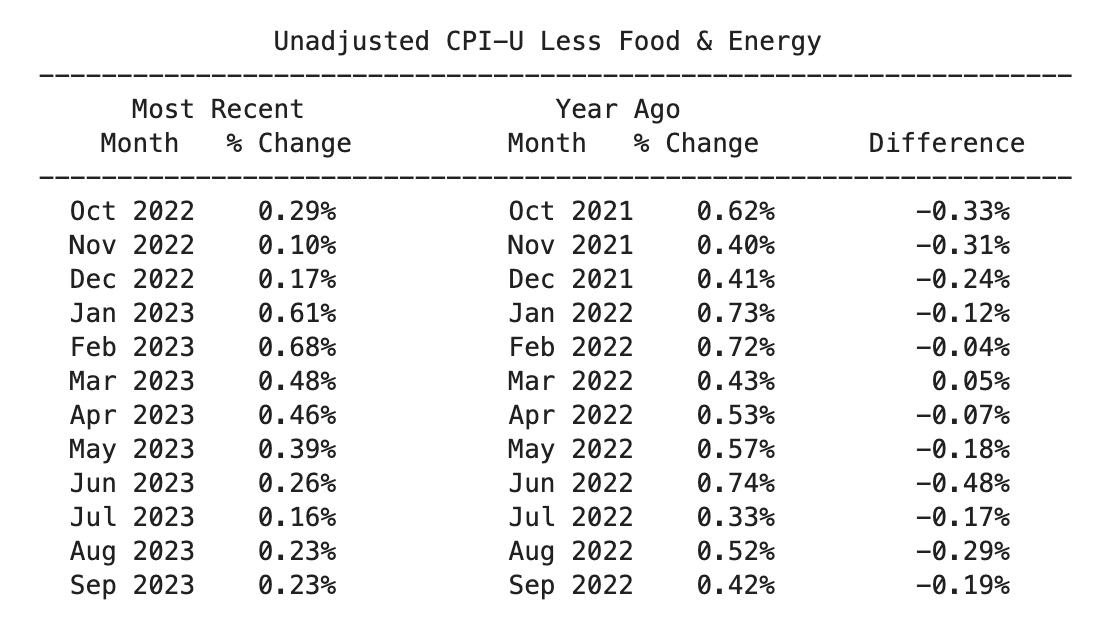
To make sense of these data, start with the bottom row of the table. The first two columns tell you that during September 2023, prices increased by ||0.23\%.|| To be precise, the value of the CPI index in September 2023 was ||0.23\%|| higher than its value one month before.
The next two columns show that during the same month of September but one year earlier, in 2022, prices increased by ||0.42\%||.
The final column shows that the most recent increase was smaller than the increase one year ago. The current percentage increase minus the year ago percentage increase is ||0.19\%.||
These numbers are absolute price changes over just one month. To convert them into the more familiar form of an annual rate, multiply by twelve. As annualized rates, the inflation rate this September was
$$12 * 0.23\% = 2.76\%$$
Last September it was
$$12 * 0.23\% = 5.04\%$$
||11|| out of ||12||
Look again at the final column, now highlighted in red:
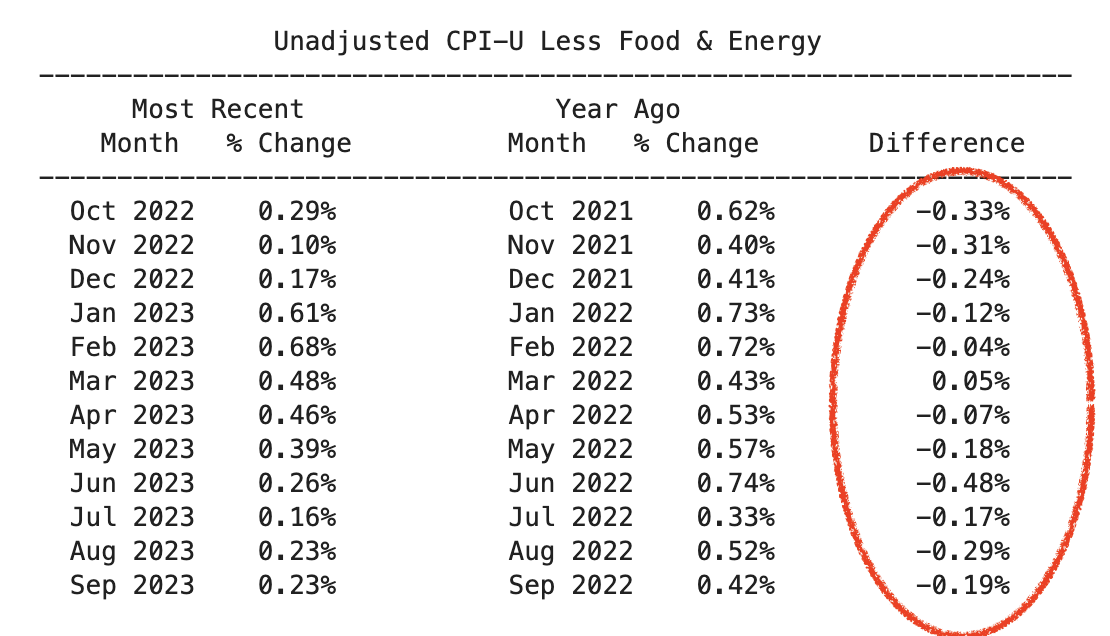
||11|| out of the ||12|| values in this column are negative. For ||11|| out of ||12|| of the most recent months, the recent inflation rate was lower.
If there had been no change in the underlying trend rate of inflation, the probability that chance fluctuations in the monthly inflation rate would yield ||11|| out of ||12|| comparisons that are lower more recently is about ||0.3\%.||
The only reasonable conclusion is that the trend rate of inflation has indeed come down.
Effect of Seasonality
Much of the discussion about inflation failed to recognize this dramatic pattern of falling inflation that started more than one year ago. I suspect that the confusion is caused by seasonal fluctuations in the inflation rate and problems with the procedure that the BLS uses to produce a version of the CPI that is supposed to, but fails to, remove them.
Until March of this year, I had no idea that price changes vary seasonally, nor that the seasonal changes are so large. See here for an account of how I stumbled onto the importance of seasonality in the inflation rate and the problems with the seasonally adjusted series that the BLS releases.
How Seasonal Patterns Can Mislead
To see where you will go wrong if you ignore seasonal effects, look again at the first column, which is now the one highlighted in red. It shows the percentage change in the raw index for each of the last 12 months:
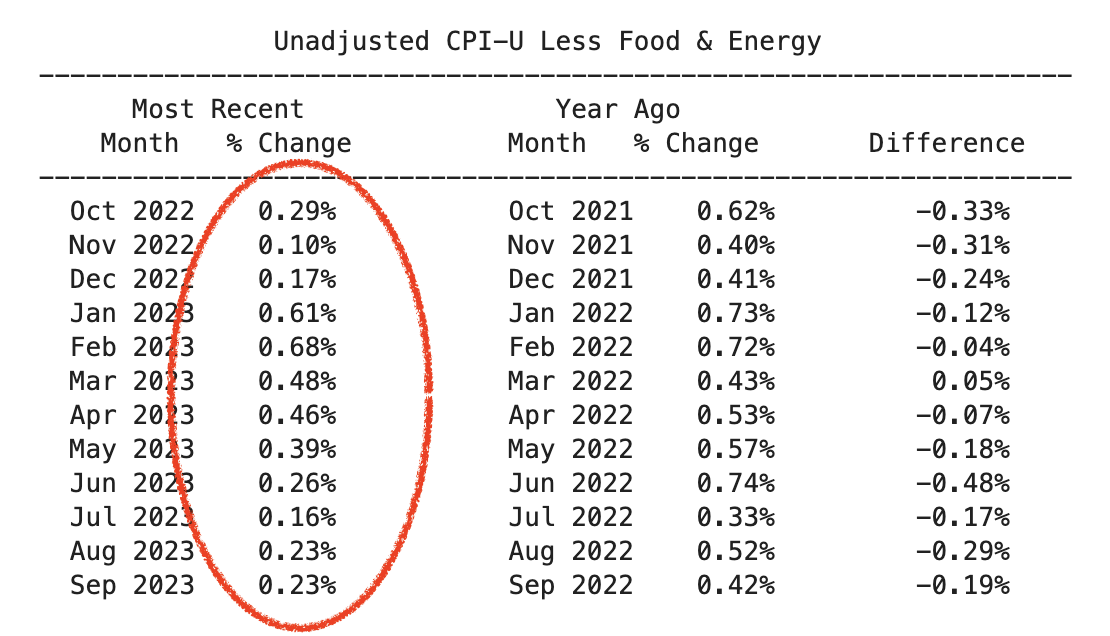
If you just looked only at these numbers, you would have been reassured by the low inflation rates during October, November and December 2022, but then alarmed by the much higher inflation rates that followed in January, February, March, and April 2023.
But you should not have been alarmed. This is what happens every year. Prices increase by less in the months leading up to Christmas then catch up by increasing faster in the first months of the new calendar year.
In the first months of 2023, you would have misinterpreted a predictable seasonal pattern as evidence that the trend rate of inflation had started to increase.
Does the Seasonally Adjusted CPI Index Prevent This Misunderstanding?
No! You would have made the same mistake if you looked at what the BLS refers to as its seasonally version of the CPI. The next table uses the seasonally adjusted version of the same index, CPI-U Less Food and Energy.
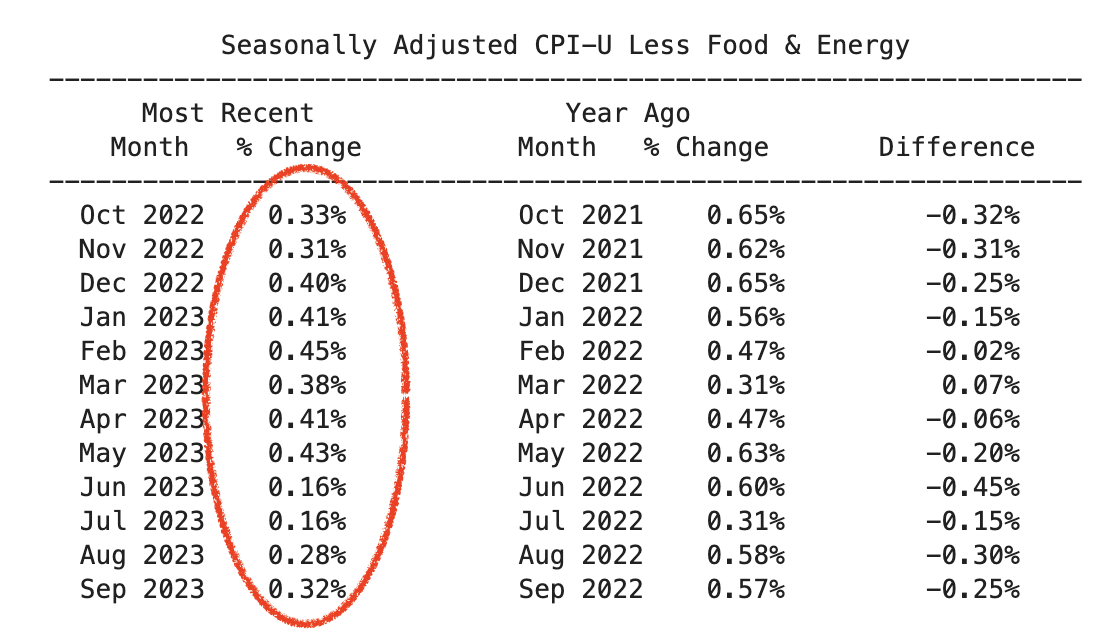
If you used the first column of data from this table, the magnitude of your error would be smaller, but you would still misunderstand what the data show.
The numbers from this version of the first column would have told you that inflation was low during October and November 2022, but would then have suggested that inflation moved up in December 2022, and remained higher through May 2023.
Once gain, a seasonal pattern would have led you astray. But why is there still a seasonal pattern in the series that is supposed to be “seasonally adjusted.”
Why is the BLS Seasonal Adjustment Insufficient?
The difference between the first columns for the table based on the BLS seasonally adjusted index and the one based on the raw data shows that the BLS adjustment goes in the right direction but does not go far enough to fully remove the season effect. This is exactly what one would expect from the description that the BLS gives of how it implements seasonal adjustment.
From that description, what you learn is that the procedure should work fine at a time when there is no change in the underlying trend rate of inflation, but will fail precisely when we need it–when the trend rate is changing. The technical description of this problem is that there is no way to “identify” both the change in the trend and the seasonal pattern. You can get an estimate of the seasonal effect by relying on “identification by assumption” and assuming that there is no change in the underlying trend. But as we have seen, if you test this assumption of no change in the trend, the data easily reject it. If one makes the far more plausible assumption that there is no change in the seasonal pattern between 2022 and 2023, you can use the same-month differences as I have done here. What the BLS seems to have done is adopt a compromise that lies in between these two approaches.
The Safe Strategy
Inference always relies on assumptions.
The assumption that justifies the claims made in this post is that the seasonal pattern of price changes did not change between calendar year 2022 and calendar year 2023.
Under that assumption, the safe and fully effective way to remove any effect that is specific to a month of the year is to compare the price increase during the most recent instance of that month with the price increase in the same month, one year before.
The first table shows that this removes the seasonality from the raw CPI index. The second table shows that it removes the left-over seasonality that still is present in the “seasonally adjusted” version of the CPI index.
Look at the final column for either series. In both cases, it shows that for 11 out of 12 months, the most recent one has a lower inflation rate that the same month one year earlier.
Inflation is Much Lower
The claim that I started making about inflation some 12 months ago can no longer be denied. Inflation started to fall dramatically and consistently in the third or fourth quarter of 2022.
By how much now and from what level?
As noted above, the observation for September from the table based on the unadjusted CPI shows a reduction in the inflation rate by ||228|| basis points, from ||5.04\%|| one year ago to ||2.76\%|| now.
The adjusted data point to an even bigger reduction–by ||300|| basis points–from a higher level:
From
$$12 * 0.57\% = 6.84\%$$
to
$$12 * 0.32\% = 3.84\%.$$
I don’t think anyone should rely on the adjusted index, but even if you do, there is no way to avoid the conclusion that the inflation rate is dramatically lower.